What's the problem?
Enhancing IT monitoring with Nutanix Prism.
My internship was about improving Nutanix’s Prism platform, so IT administrators could monitor complex, hybrid environments from one place.
That meant understanding the different roles in IT, connecting infrastructure monitoring back to business goals, and stretching Prism to cover every workload and dependency in a single interface.
I was set to deliver an analysis report on the gaps and opportunities, UX concepts for data visualisation and predictive analytics, and a few rounds of validation with internal teams, ending in a final presentation of what I’d proposed.
The timeline
Understanding Nutanix Prism Analytics
Simplifying system administration.
Prism Analytics, known internally as ‘xAnalysis,’ pulls together metrics like memory, CPU, and disk usage to give IT administrators one view of how resources are being used.
Admins can monitor performance, set up alerts, and spot bottlenecks quickly, which keeps resource allocation and infrastructure health in check.
It also makes root-cause analysis faster by pointing to the systems actually causing the problem.
Typical user journey for a Root Cause Analysis
A day in the life of an IT administrator.
To understand how administrators use the tool, I mapped out a typical journey for tracking down the root cause of an issue.
Take Priya Sharma, a Senior IT Administrator at a large enterprise. Her day begins by logging into Nutanix Prism to assess the health of her company’s infrastructure.
Her main goal is to catch and fix issues before they escalate and disrupt the business.
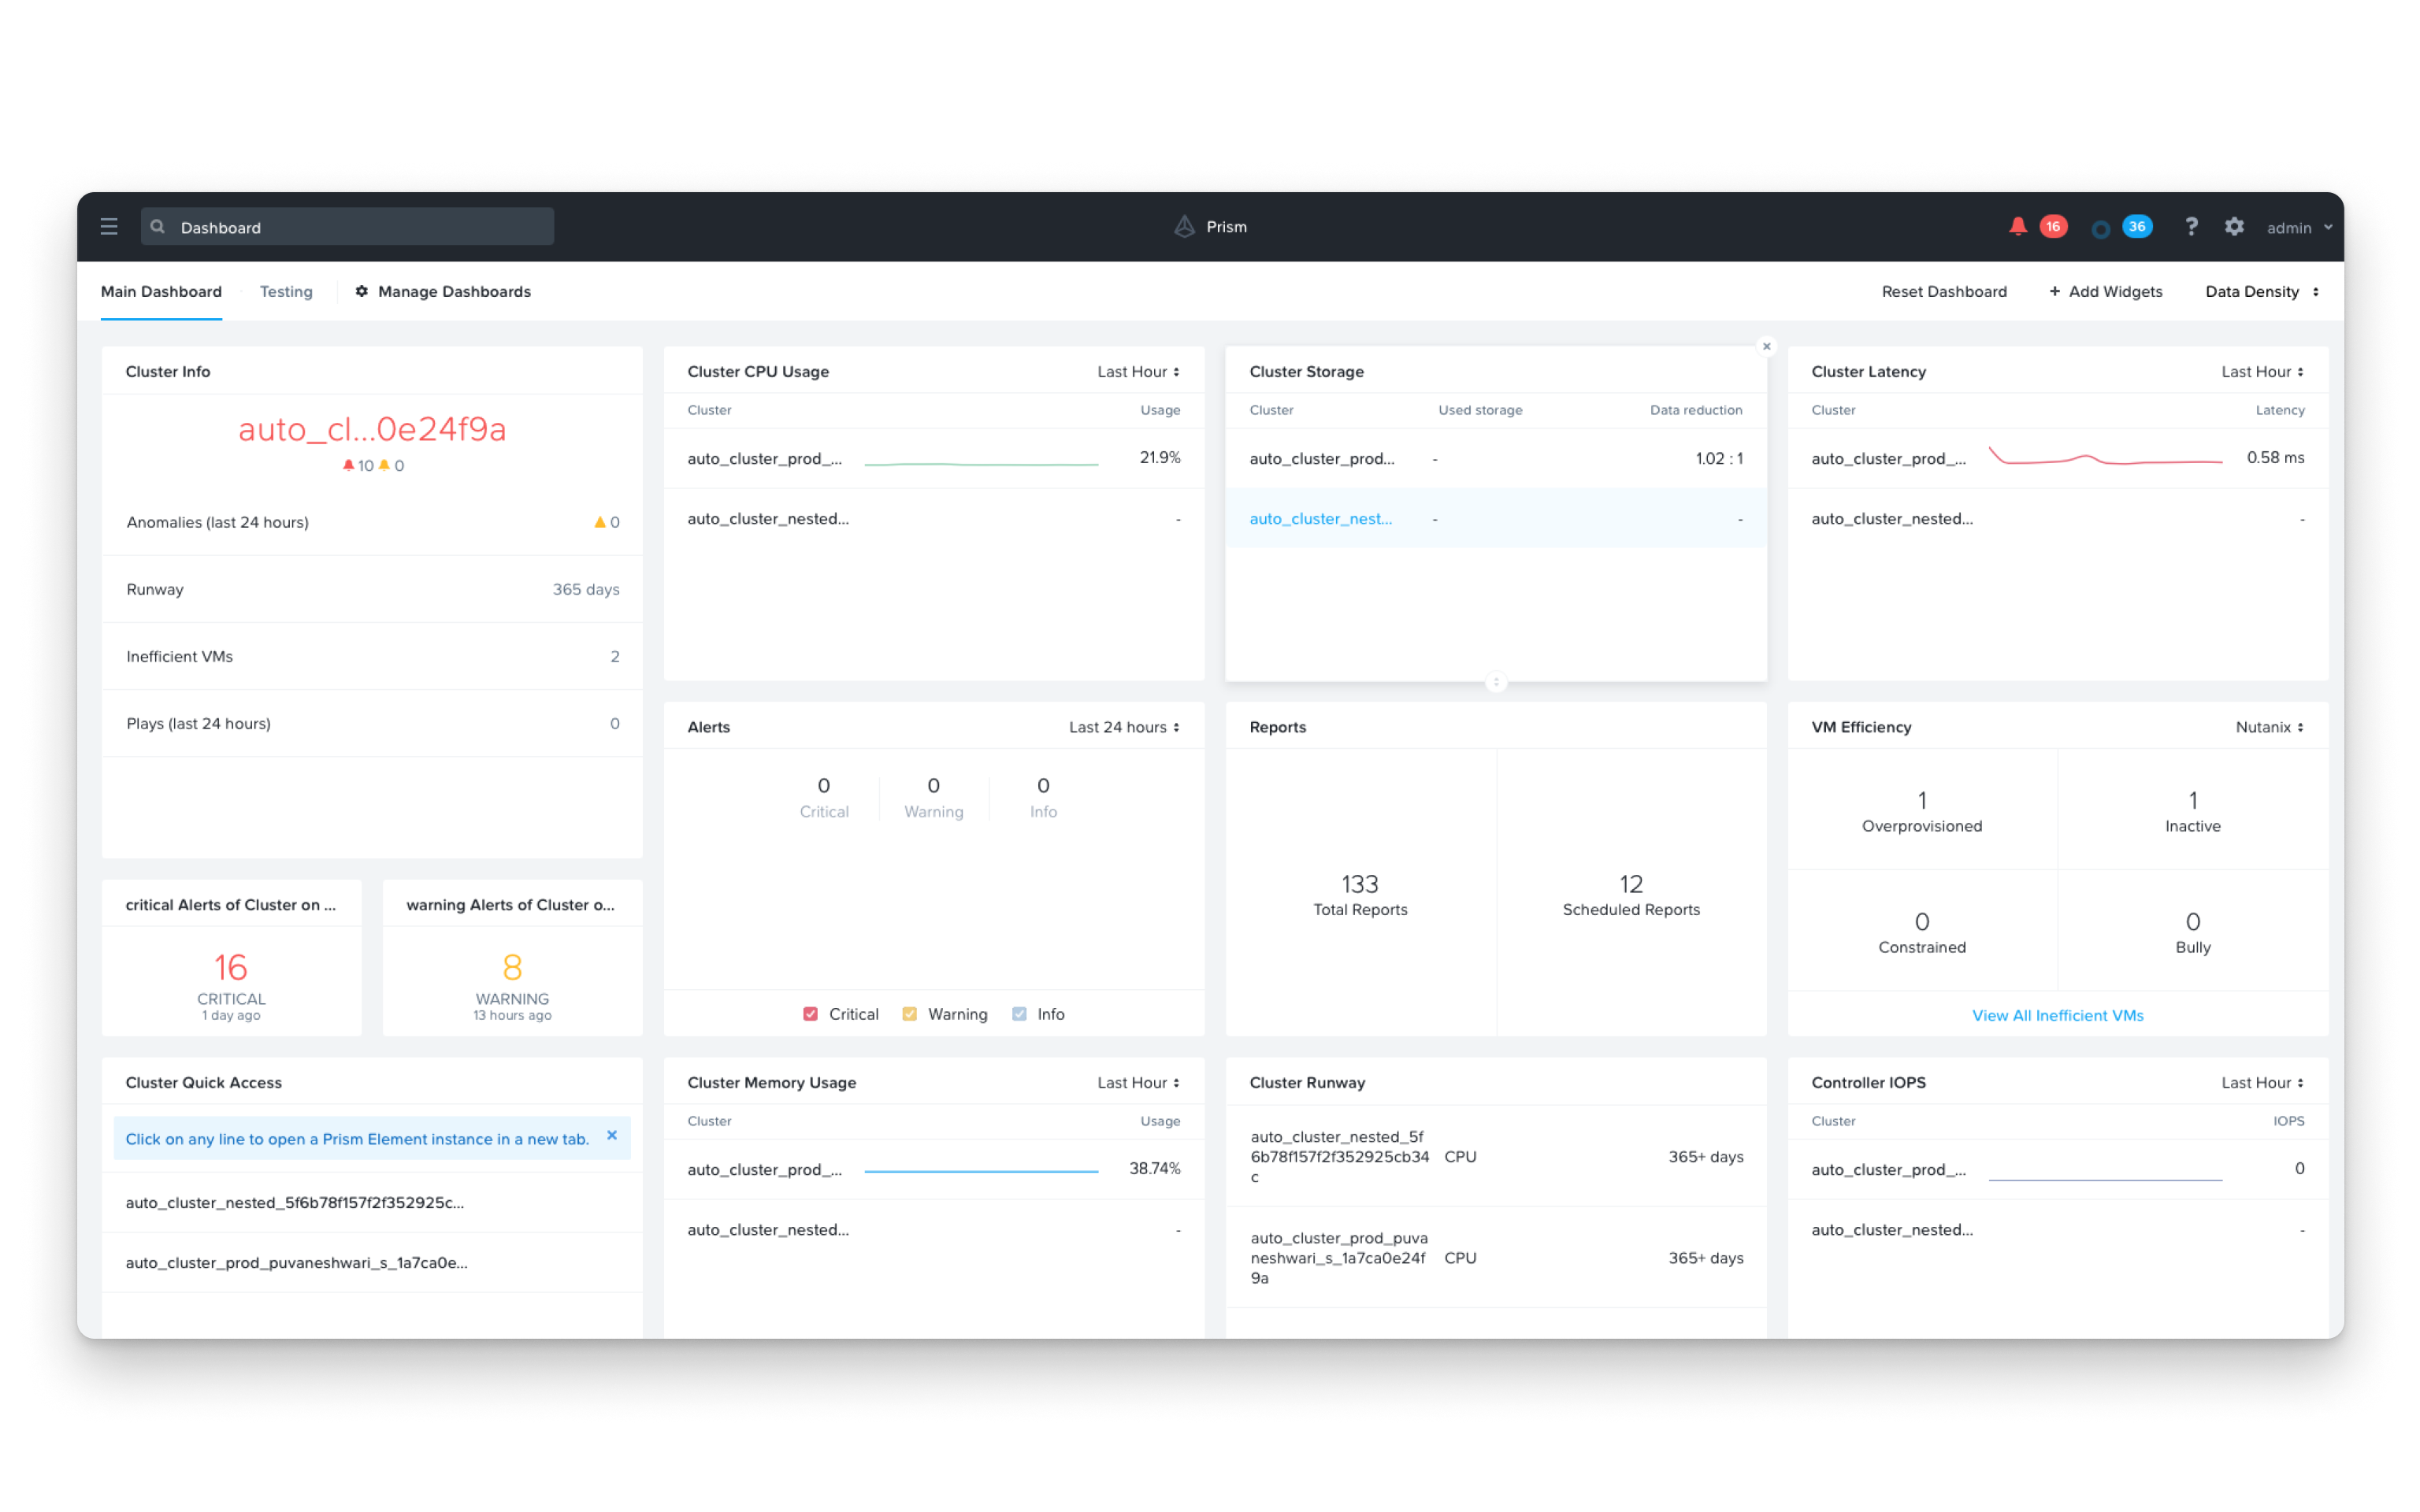
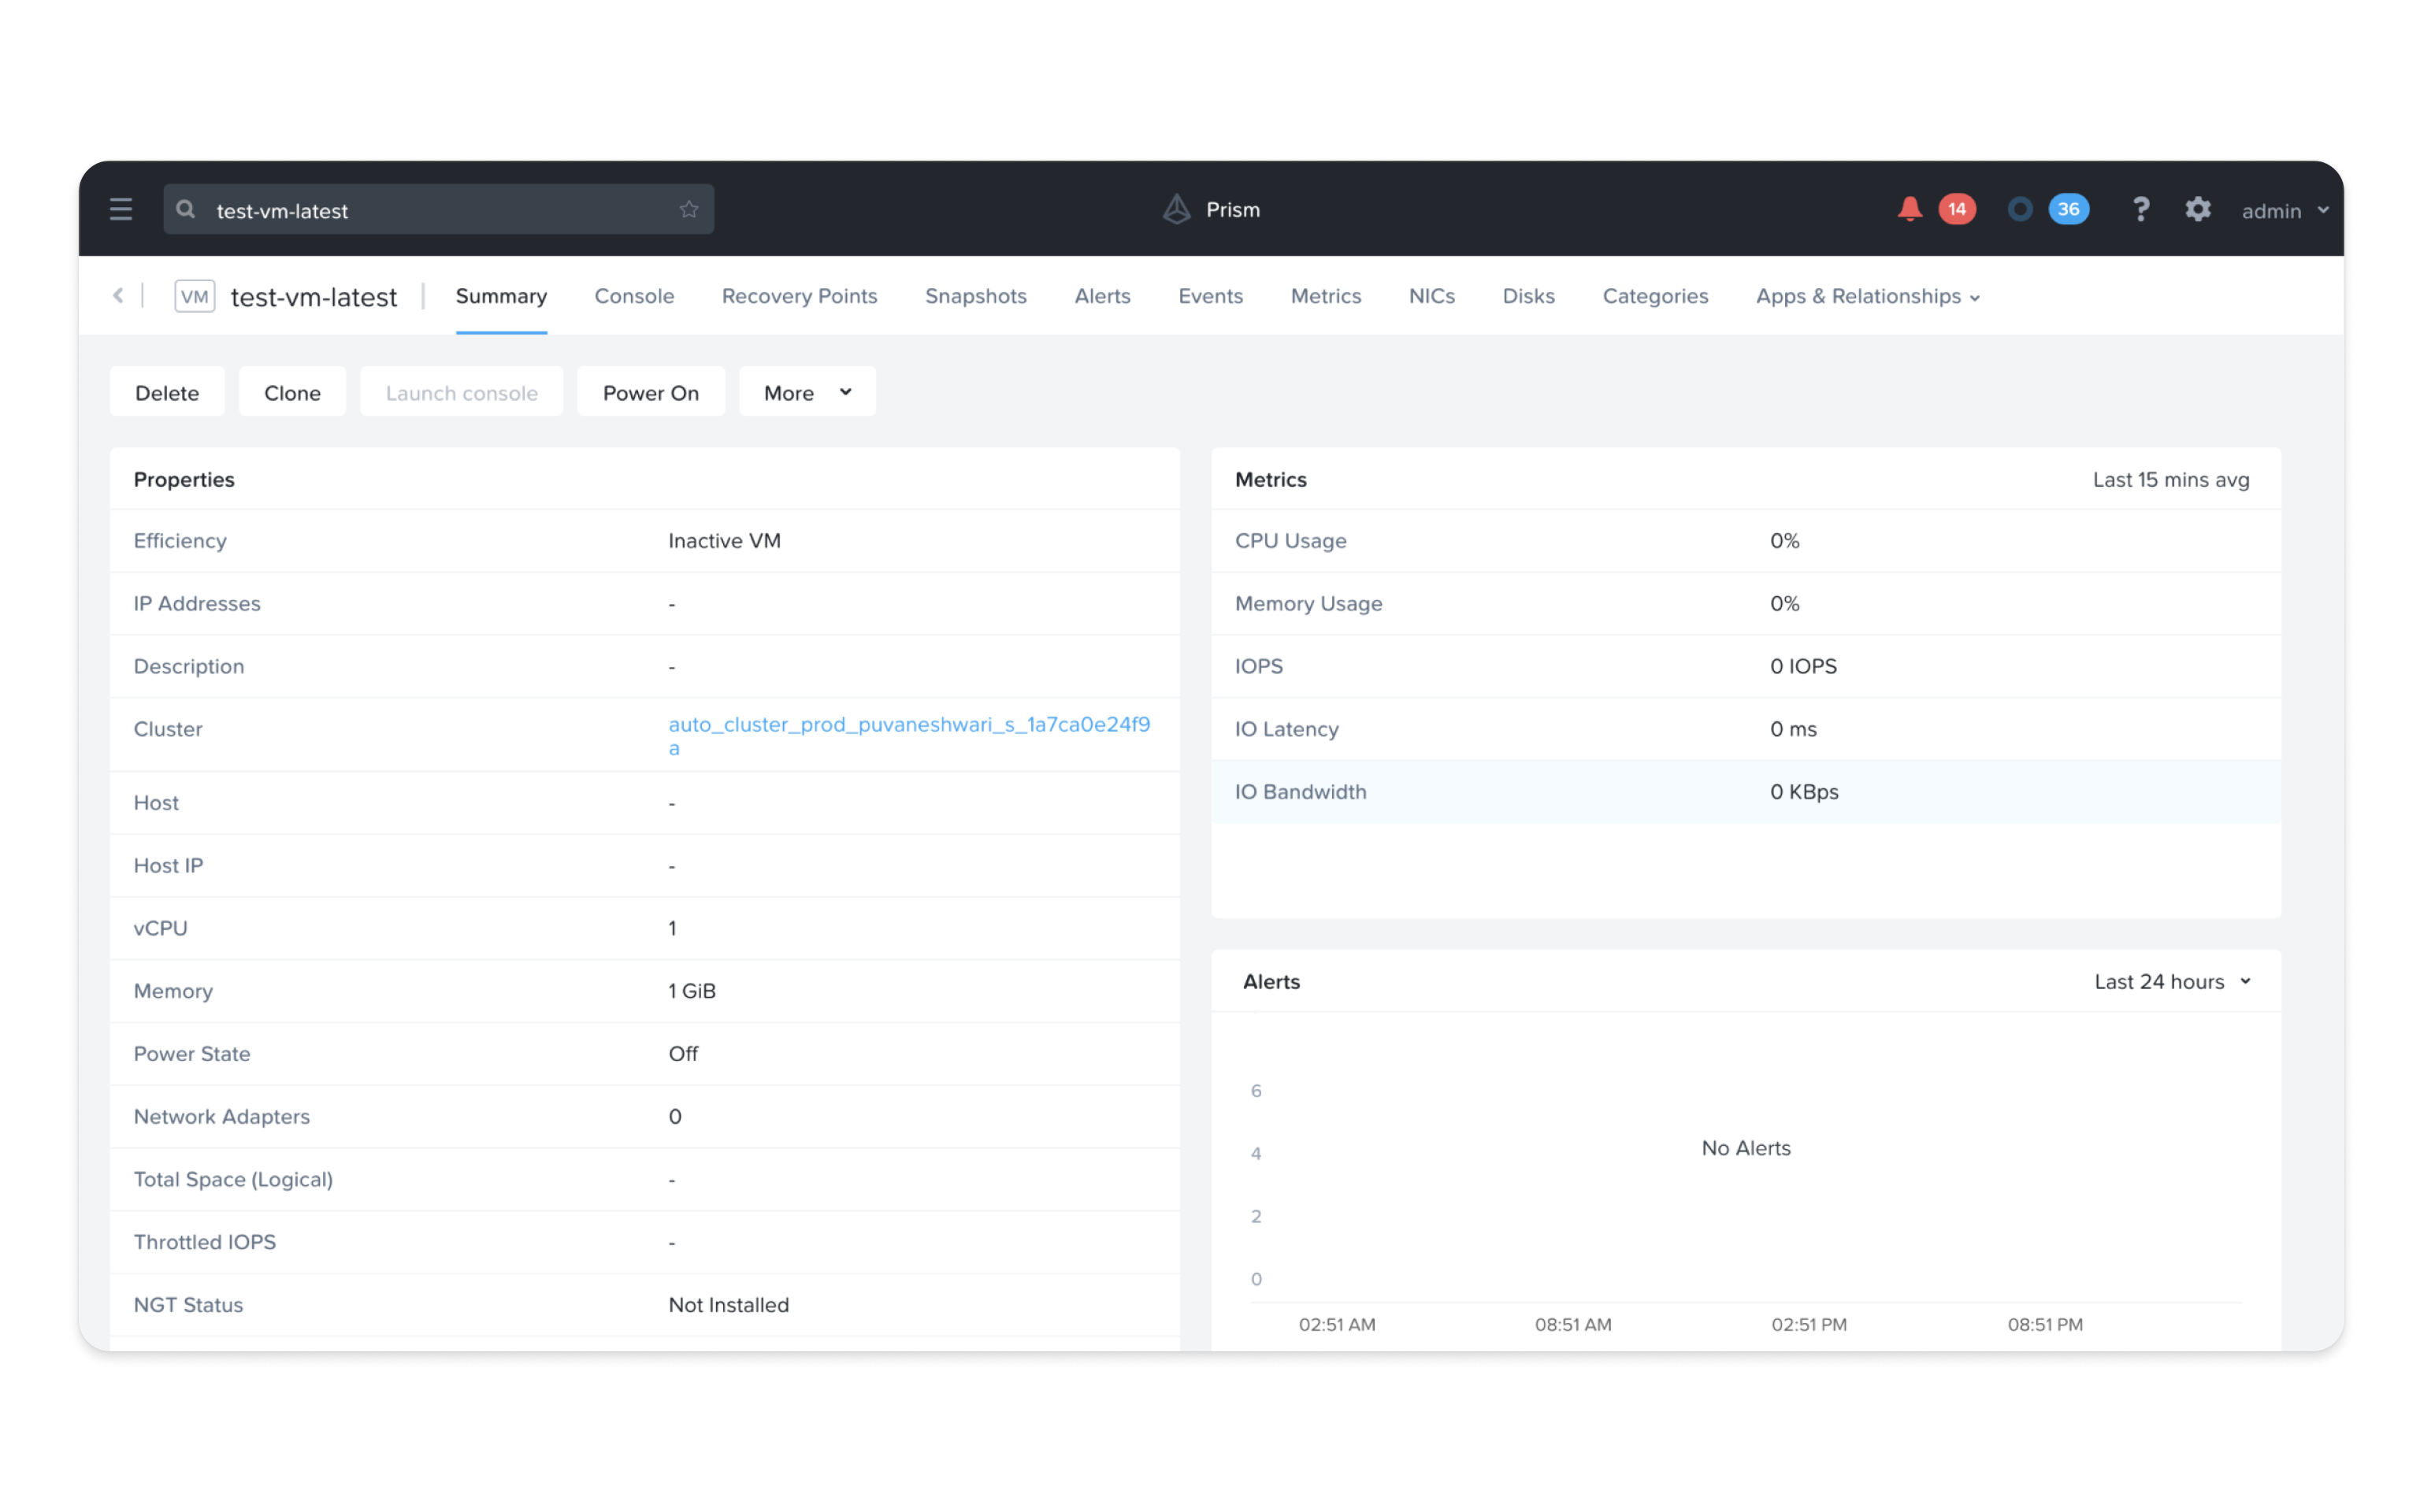
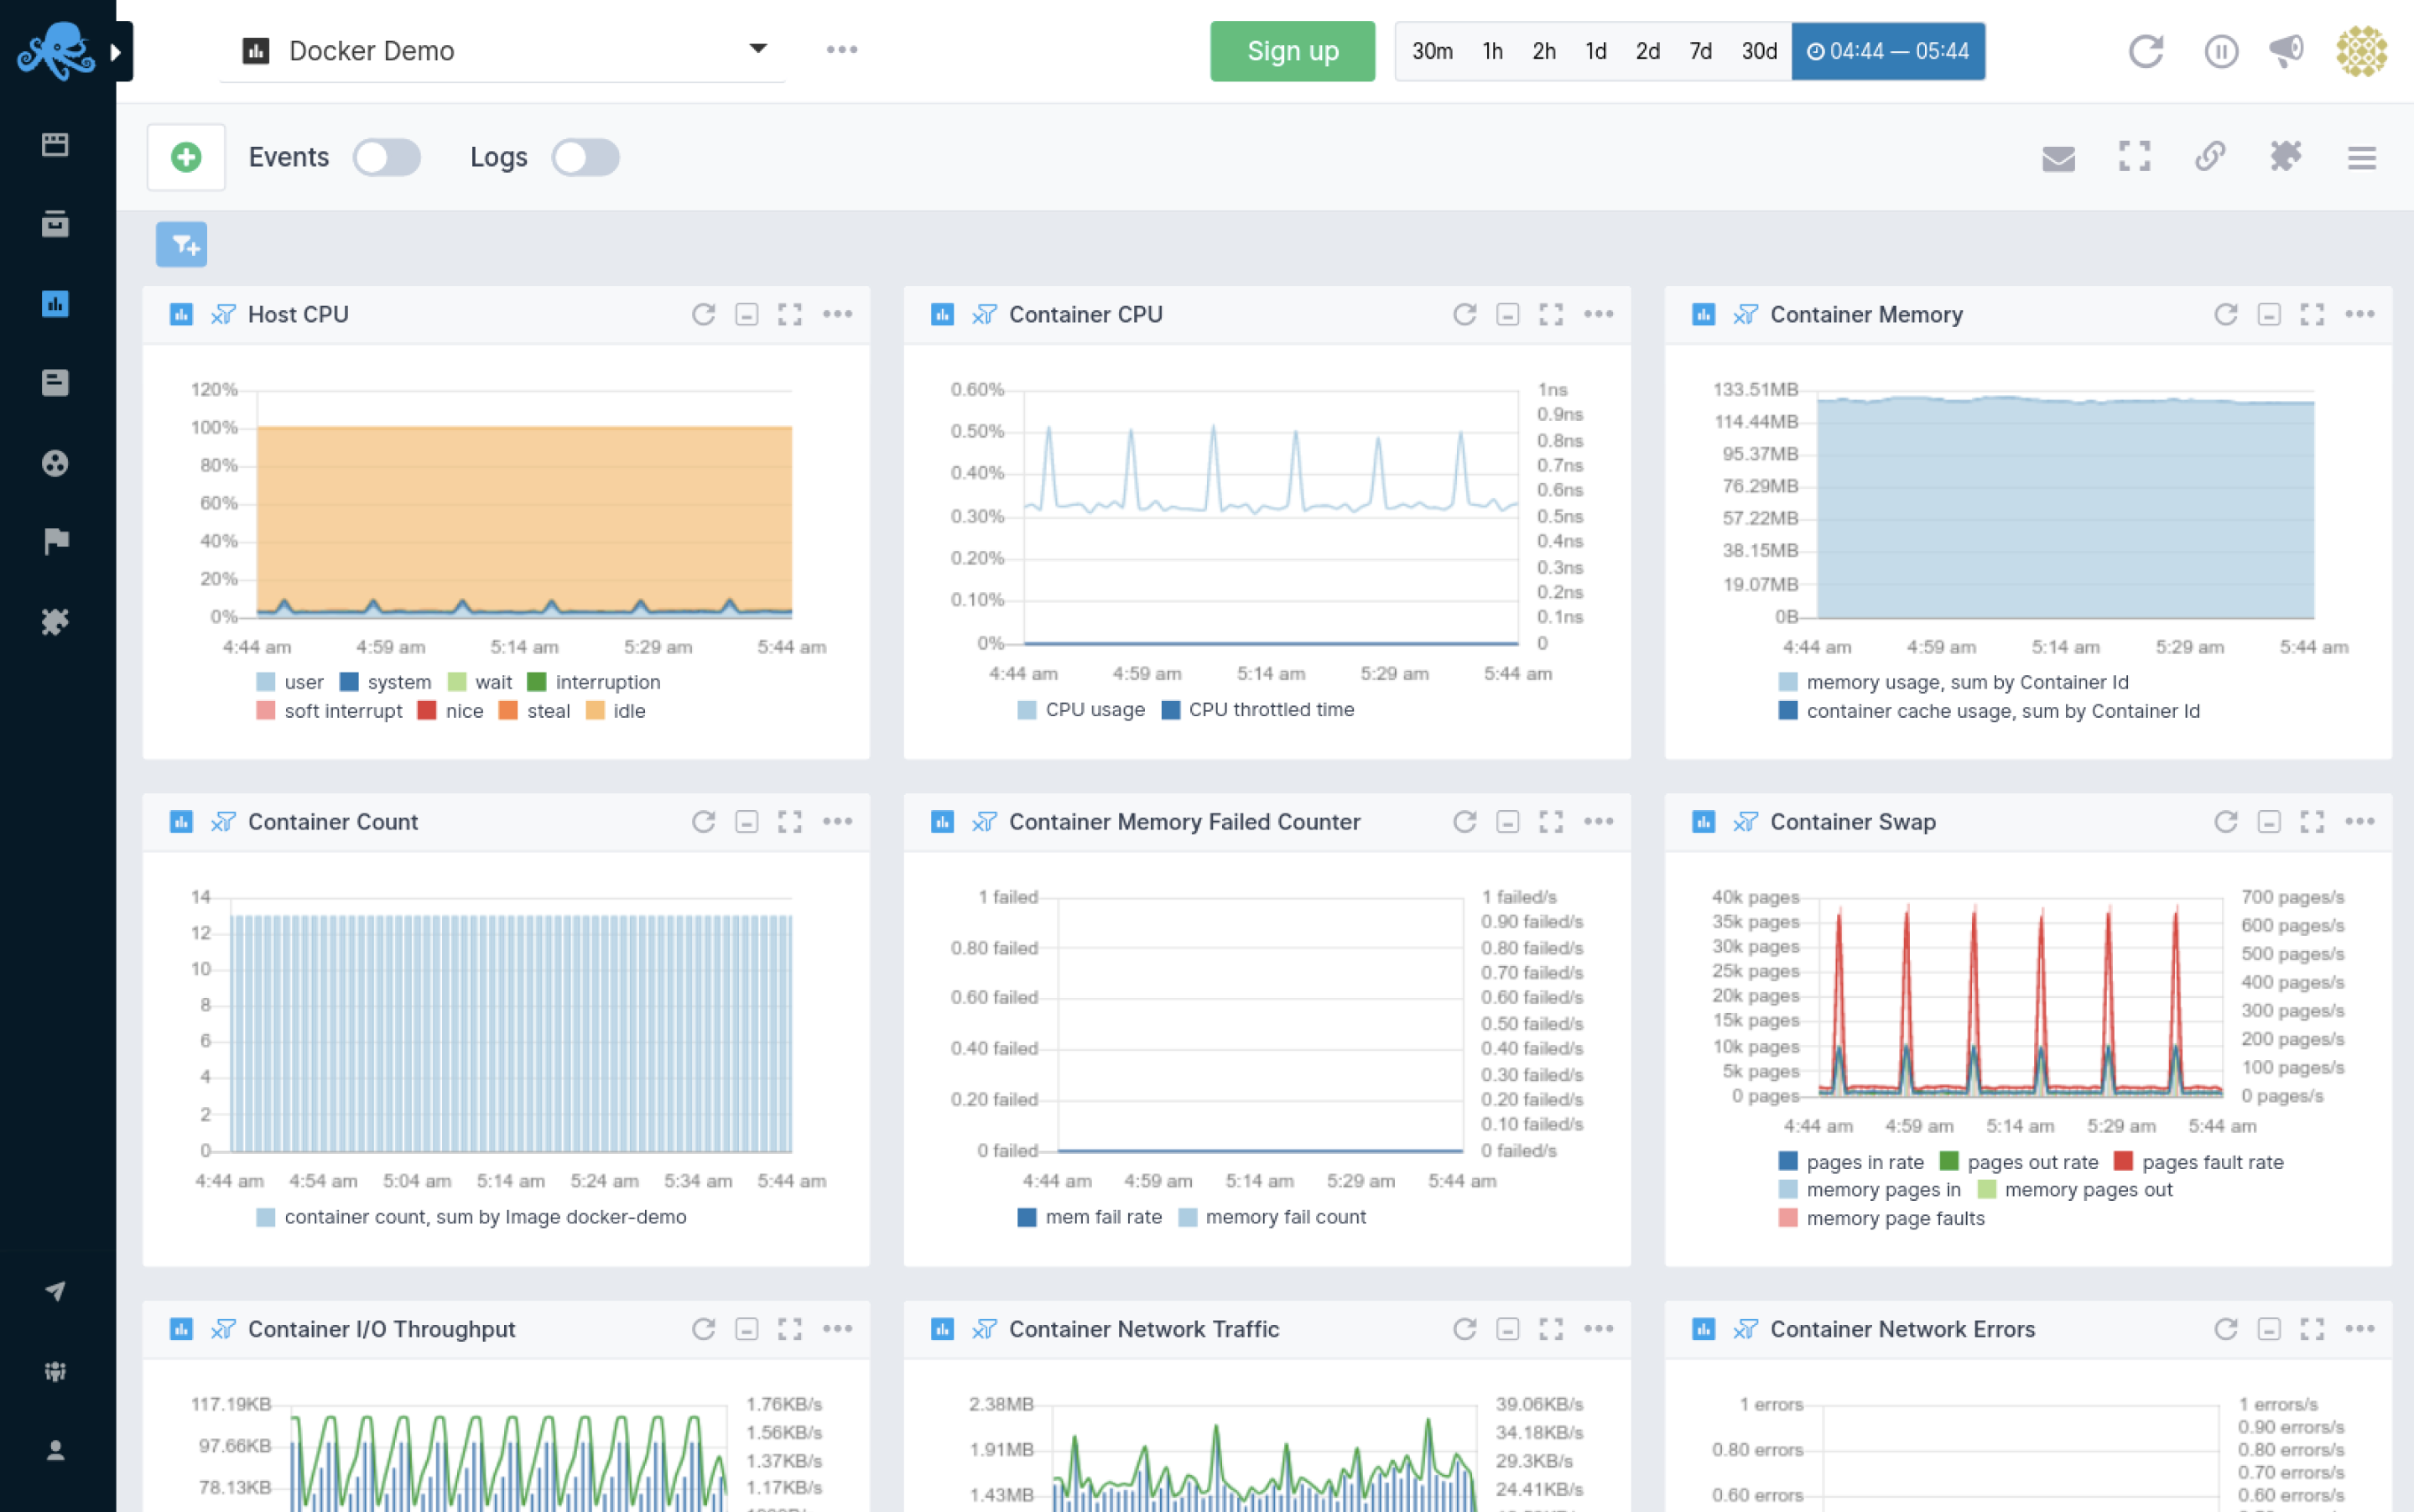
1. Monitoring Dashboard Overview
Priya checks the xAnalysis dashboard, where she sees high-level metrics such as memory, CPU, and disk usage across various clusters and VMs. This dashboard gives her an immediate understanding of critical resource utilisation. She notices that memory usage on one cluster has been flagged as a potential issue, with a high utilisation alert.
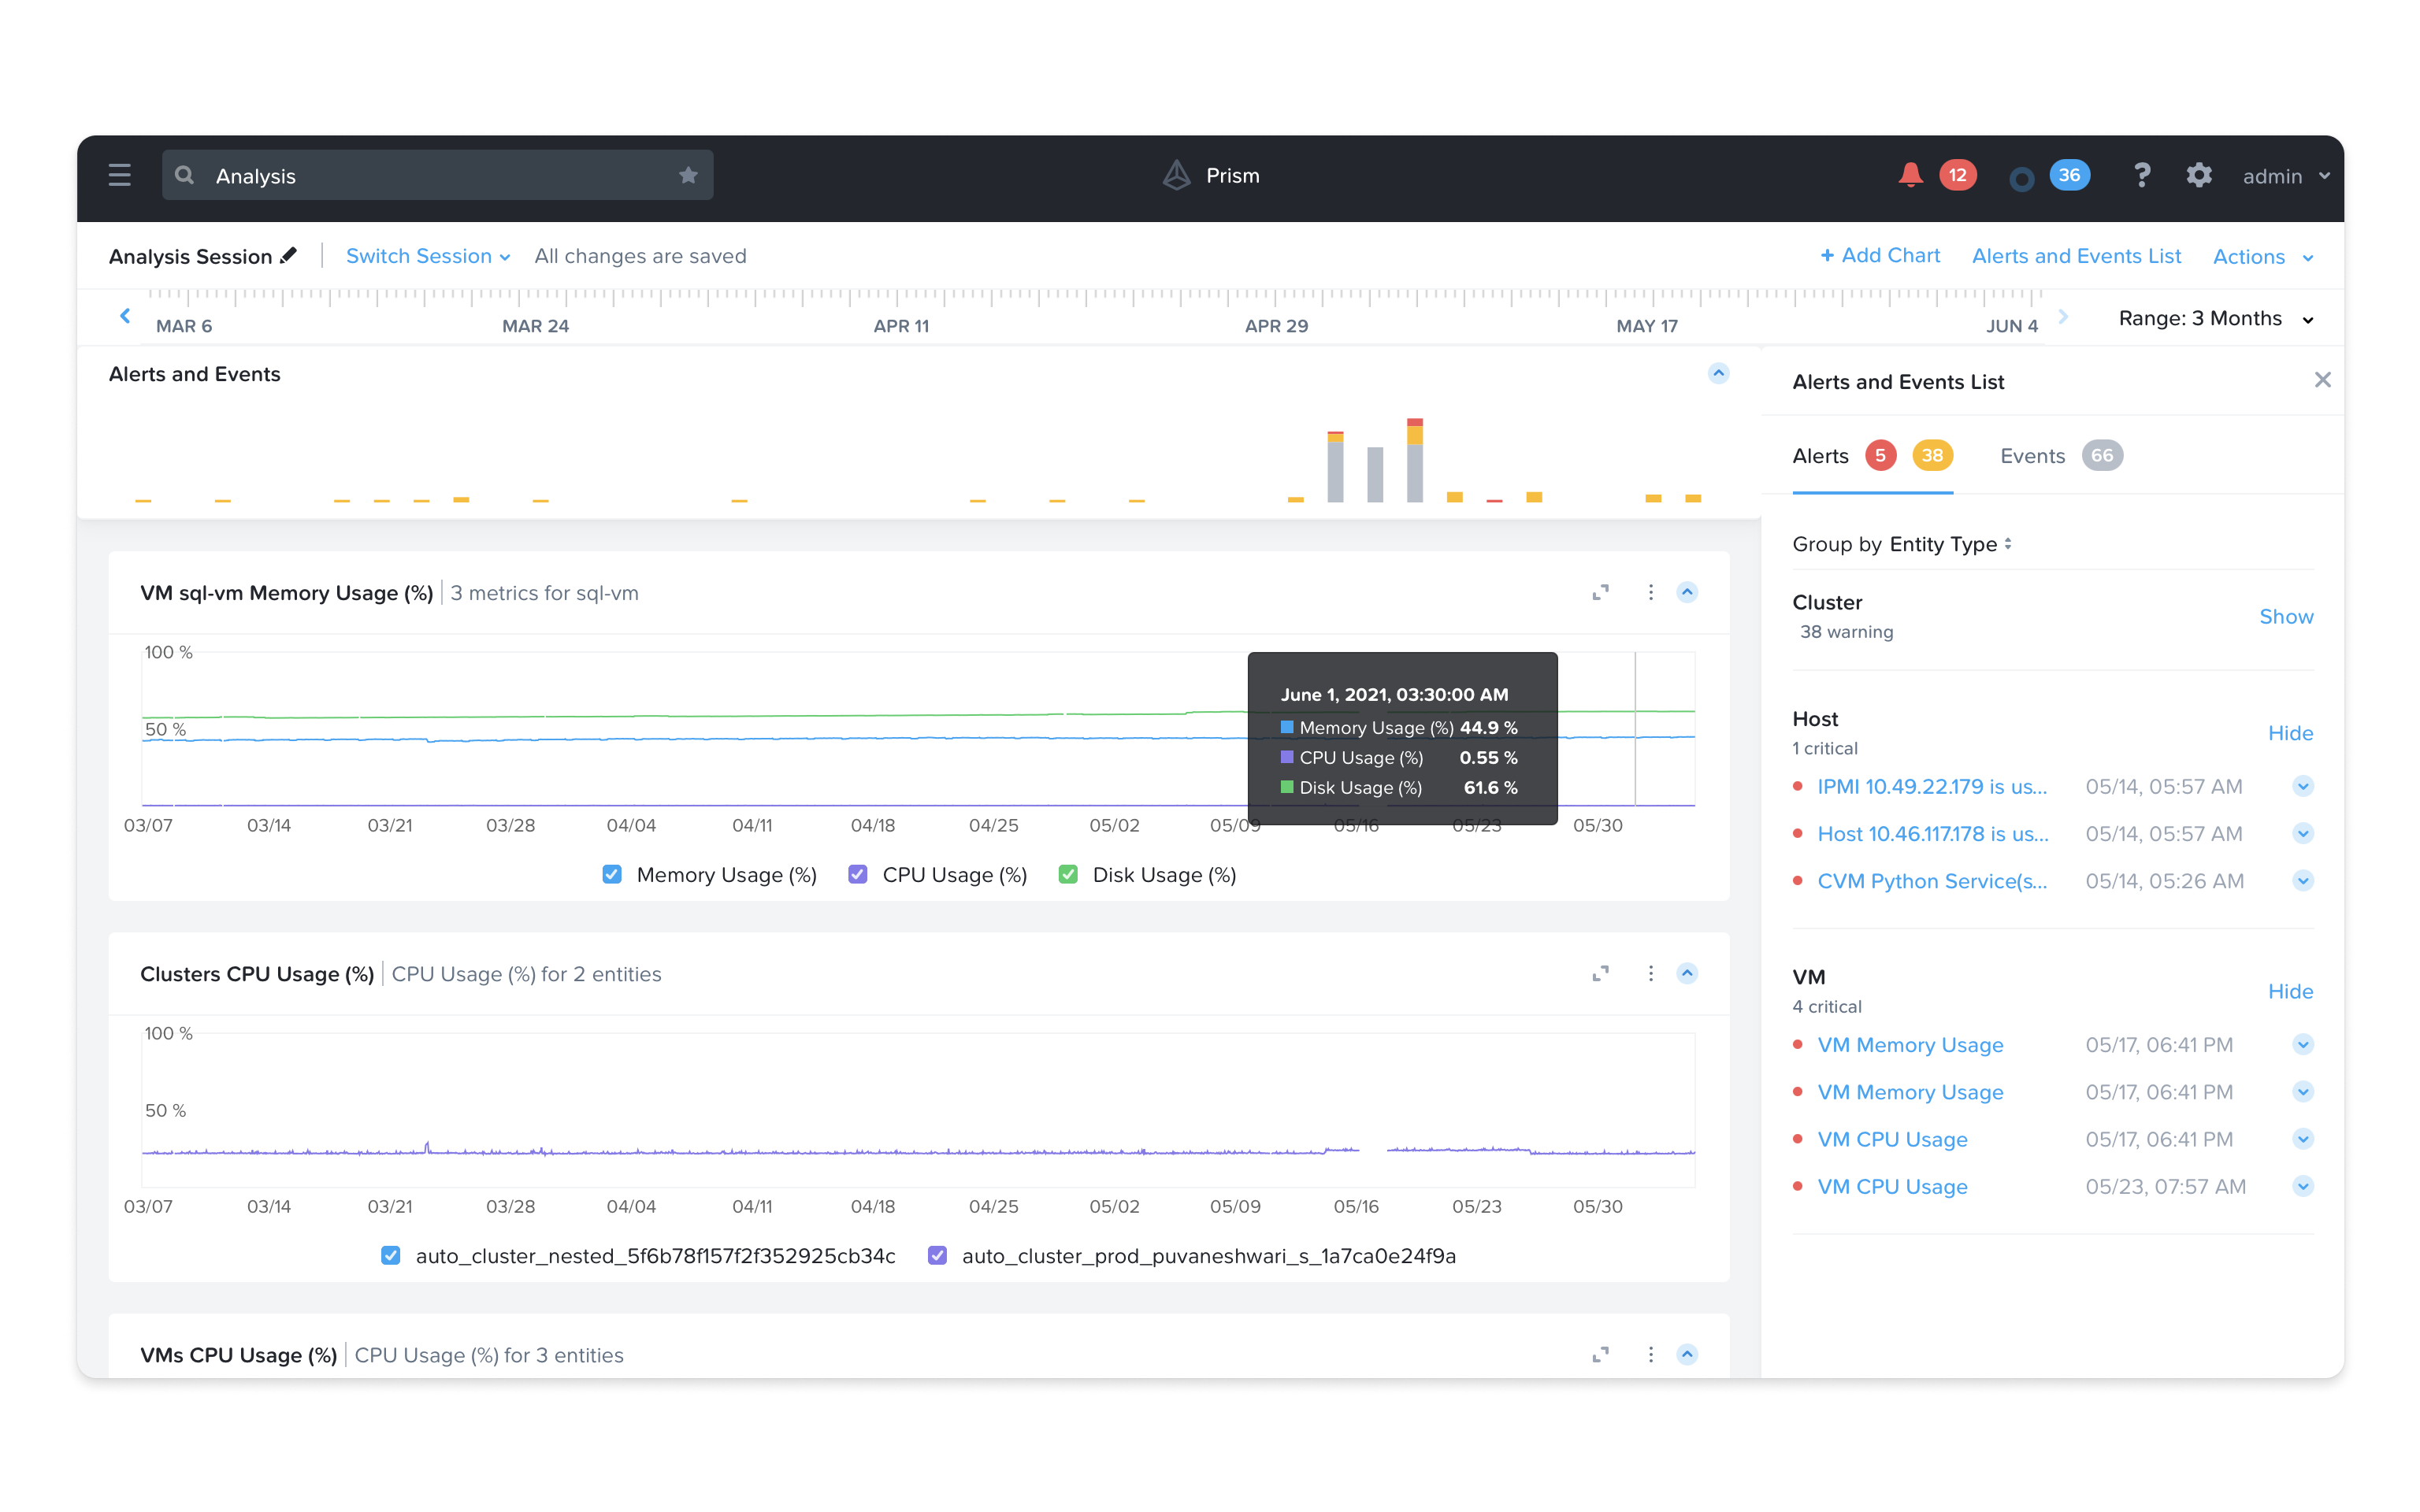
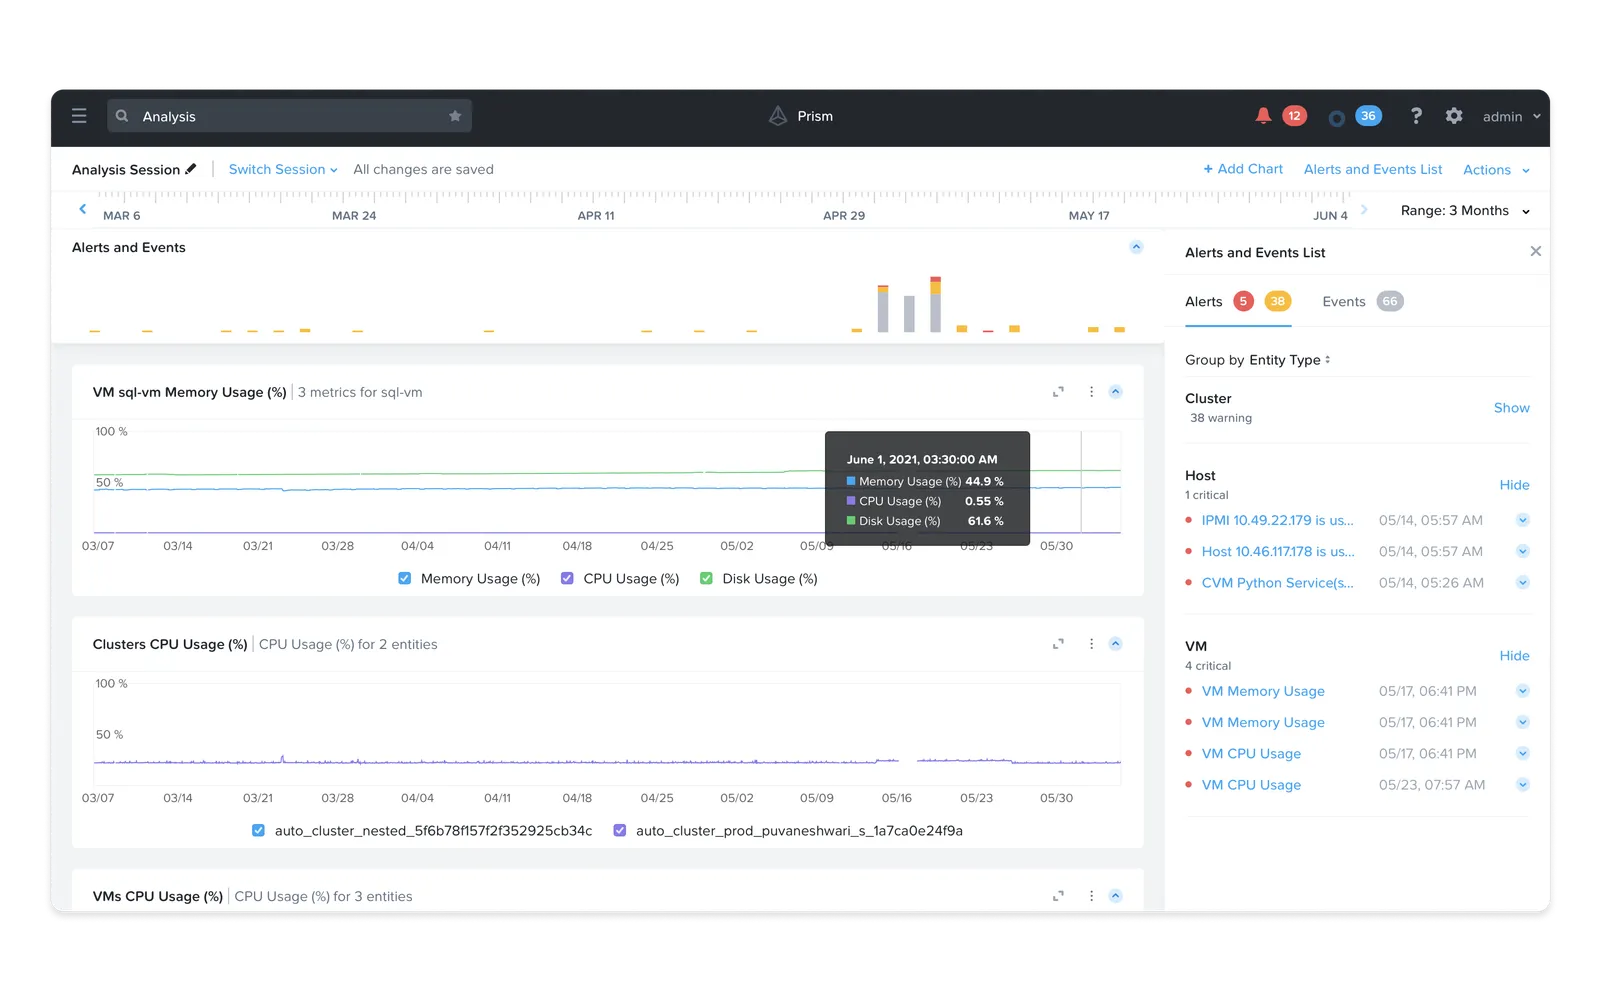
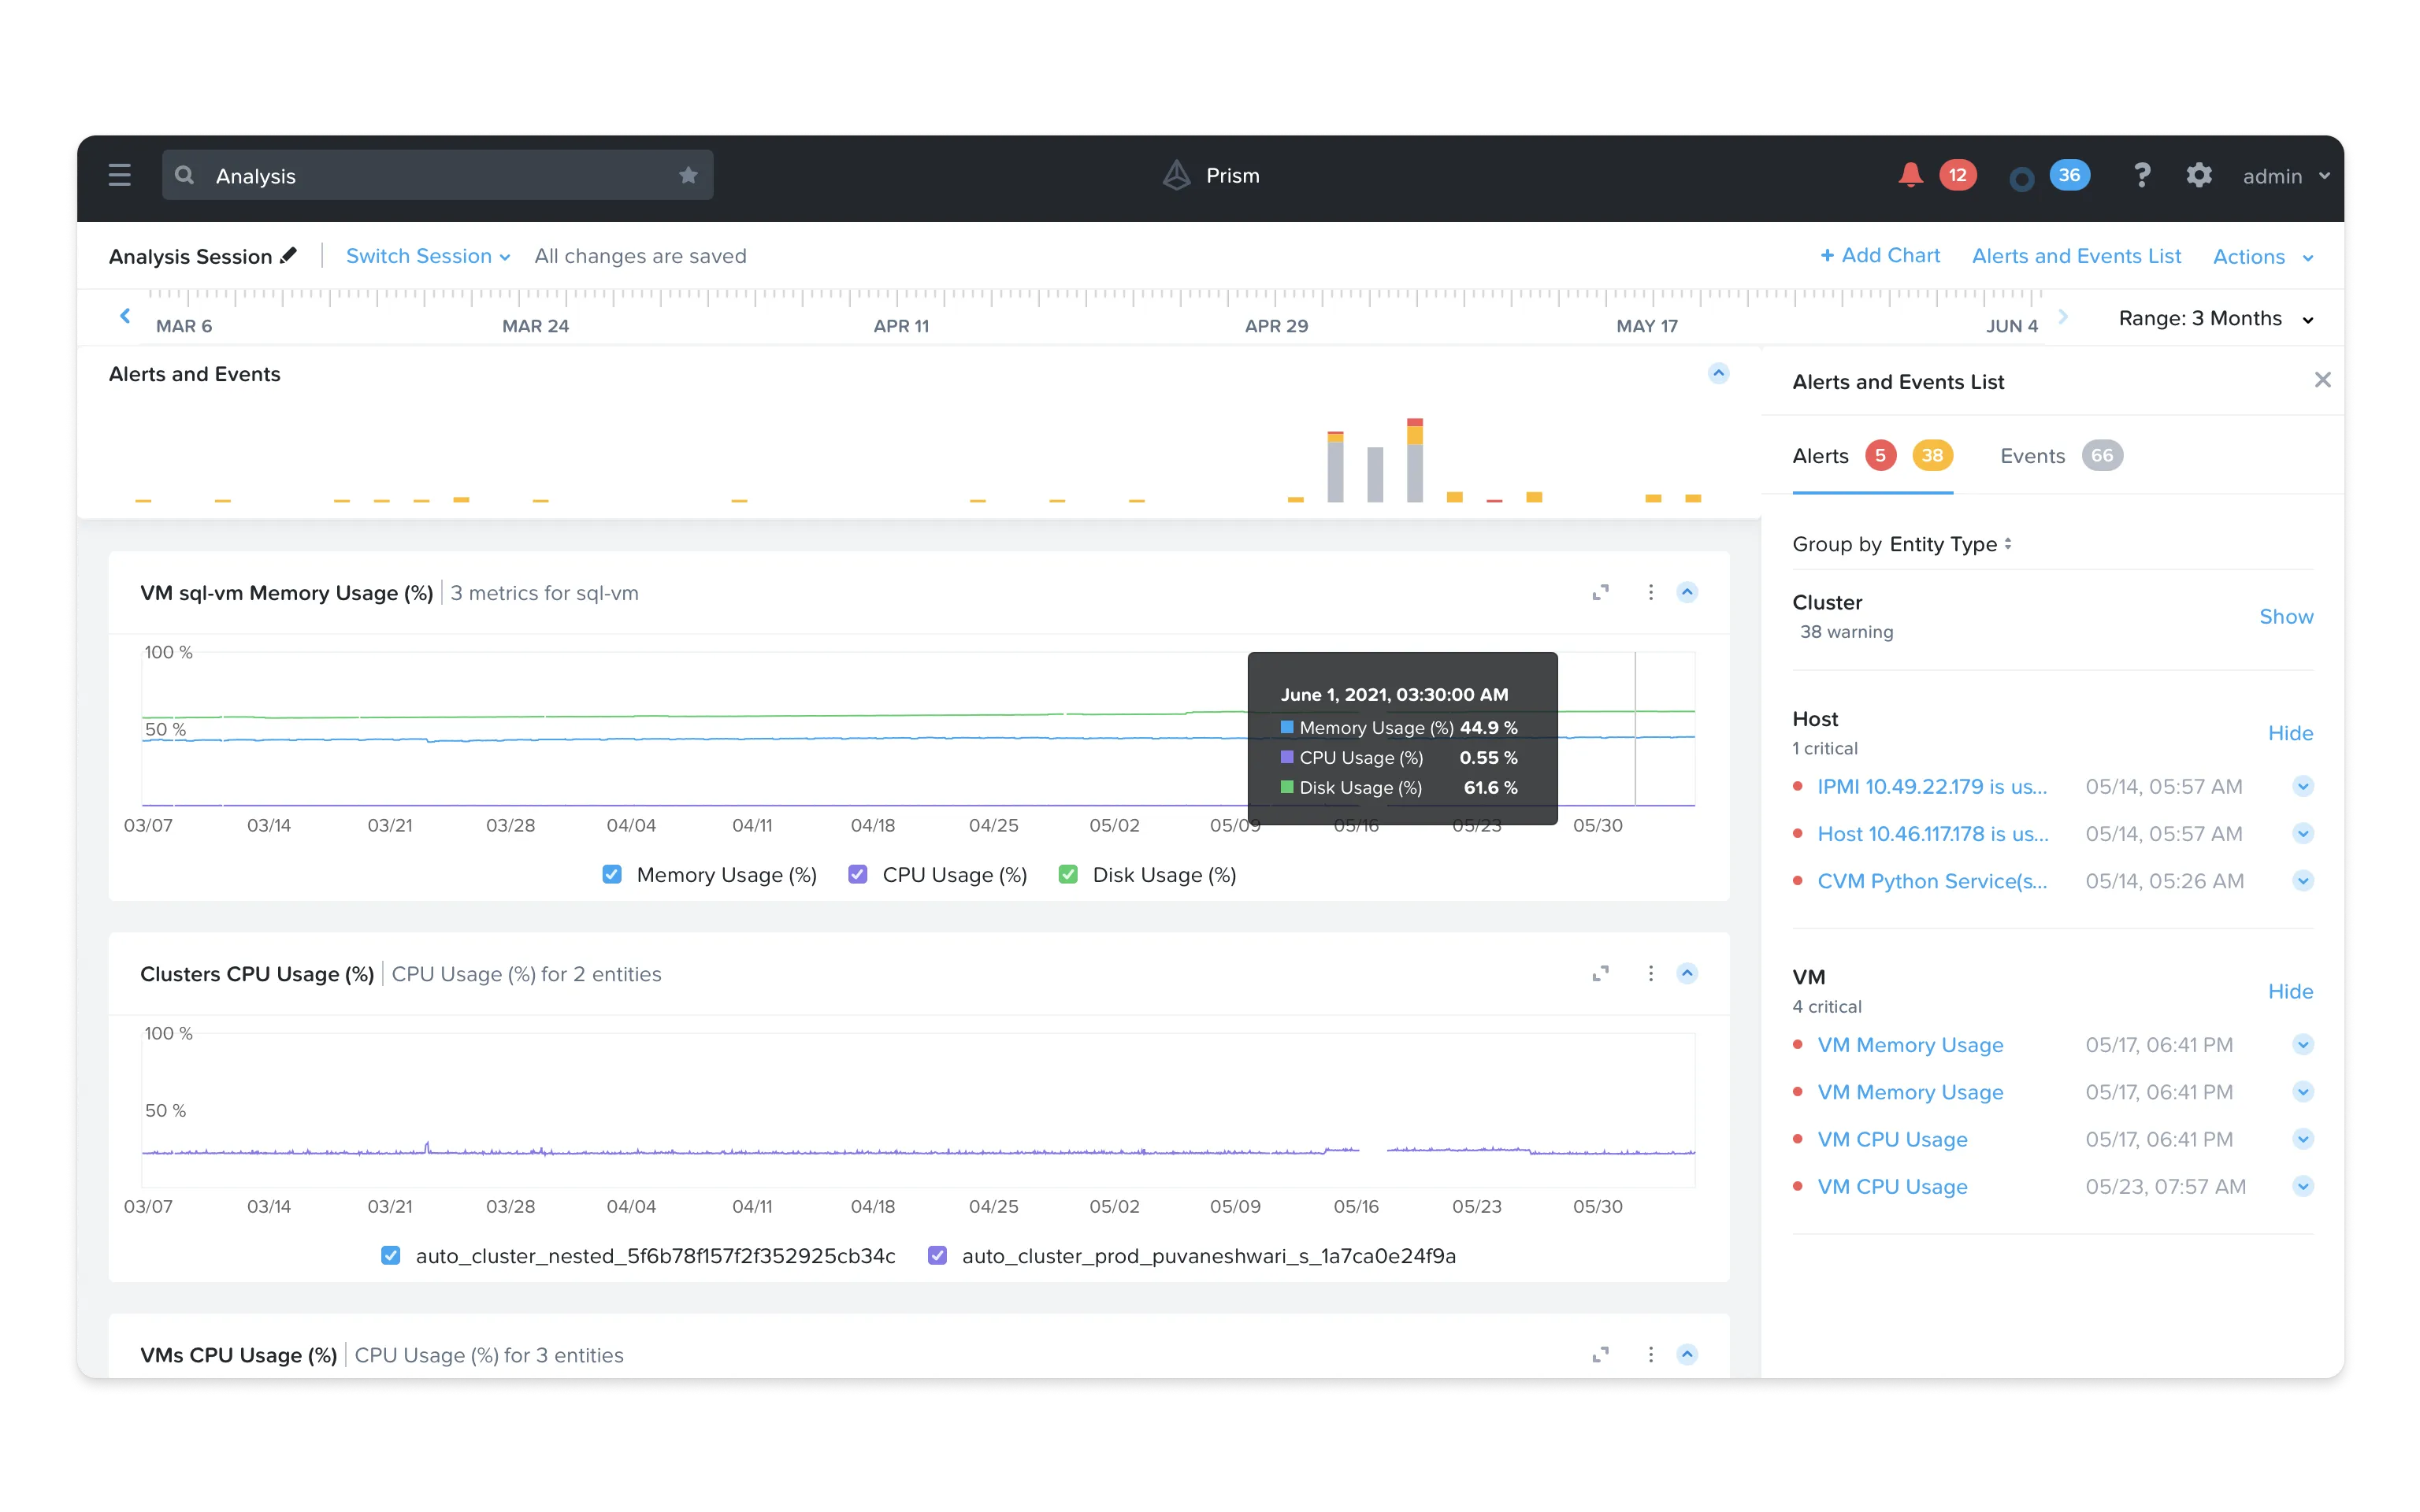
2. Drilling Down into Analysis
Priya navigates to the analysis page and initiates a new session in xAnalysis. Here, she can explore specific metrics in greater detail. She begins by filtering for memory usage metrics on the flagged cluster. Setting the time period to the last 24 hours, she adds charts to visualise spikes or unusual activity patterns. A significant memory usage spike is detected in one VM at 3 a.m. Reviewing additional metrics like CPU and disk usage, Priya identifies a rogue application or process causing the resource drain.
3. Taking Corrective Action
Based on her findings, Priya allocates additional memory to the affected VM using the Prism control panel. If necessary, she can also add a new node to the cluster to handle future workload increases.
Challenges faced during this journey
Alert Fatigue
The current system generates a high volume of alerts, which can overwhelm users and create 'noise,' potentially leading to important issues being overlooked.
Limited Application Insights
xAnalysis currently lacks deeper visibility into specific applications, making it difficult for Priya to pinpoint app-level issues without involving additional team members.
Complex Workflow
For admins new to the system, the detailed customisation options in xAnalysis may require additional time to learn, affecting the speed of issue resolution.
Lack of Forecasting
The lack of forecasting to predict when a resource, such as memory or storage, may hinder proactive management and increases the likelihood of unexpected outages.
Competitor study
Comparing the big players.
I ran a competitor analysis of the main full-stack monitoring tools: Datadog, Dynatrace, AppDynamics, and Sematext.
I focused on the features that mattered most here, like machine-learning-based alerts, code-level visibility, and real-user monitoring, to see where Prism had gaps to close.
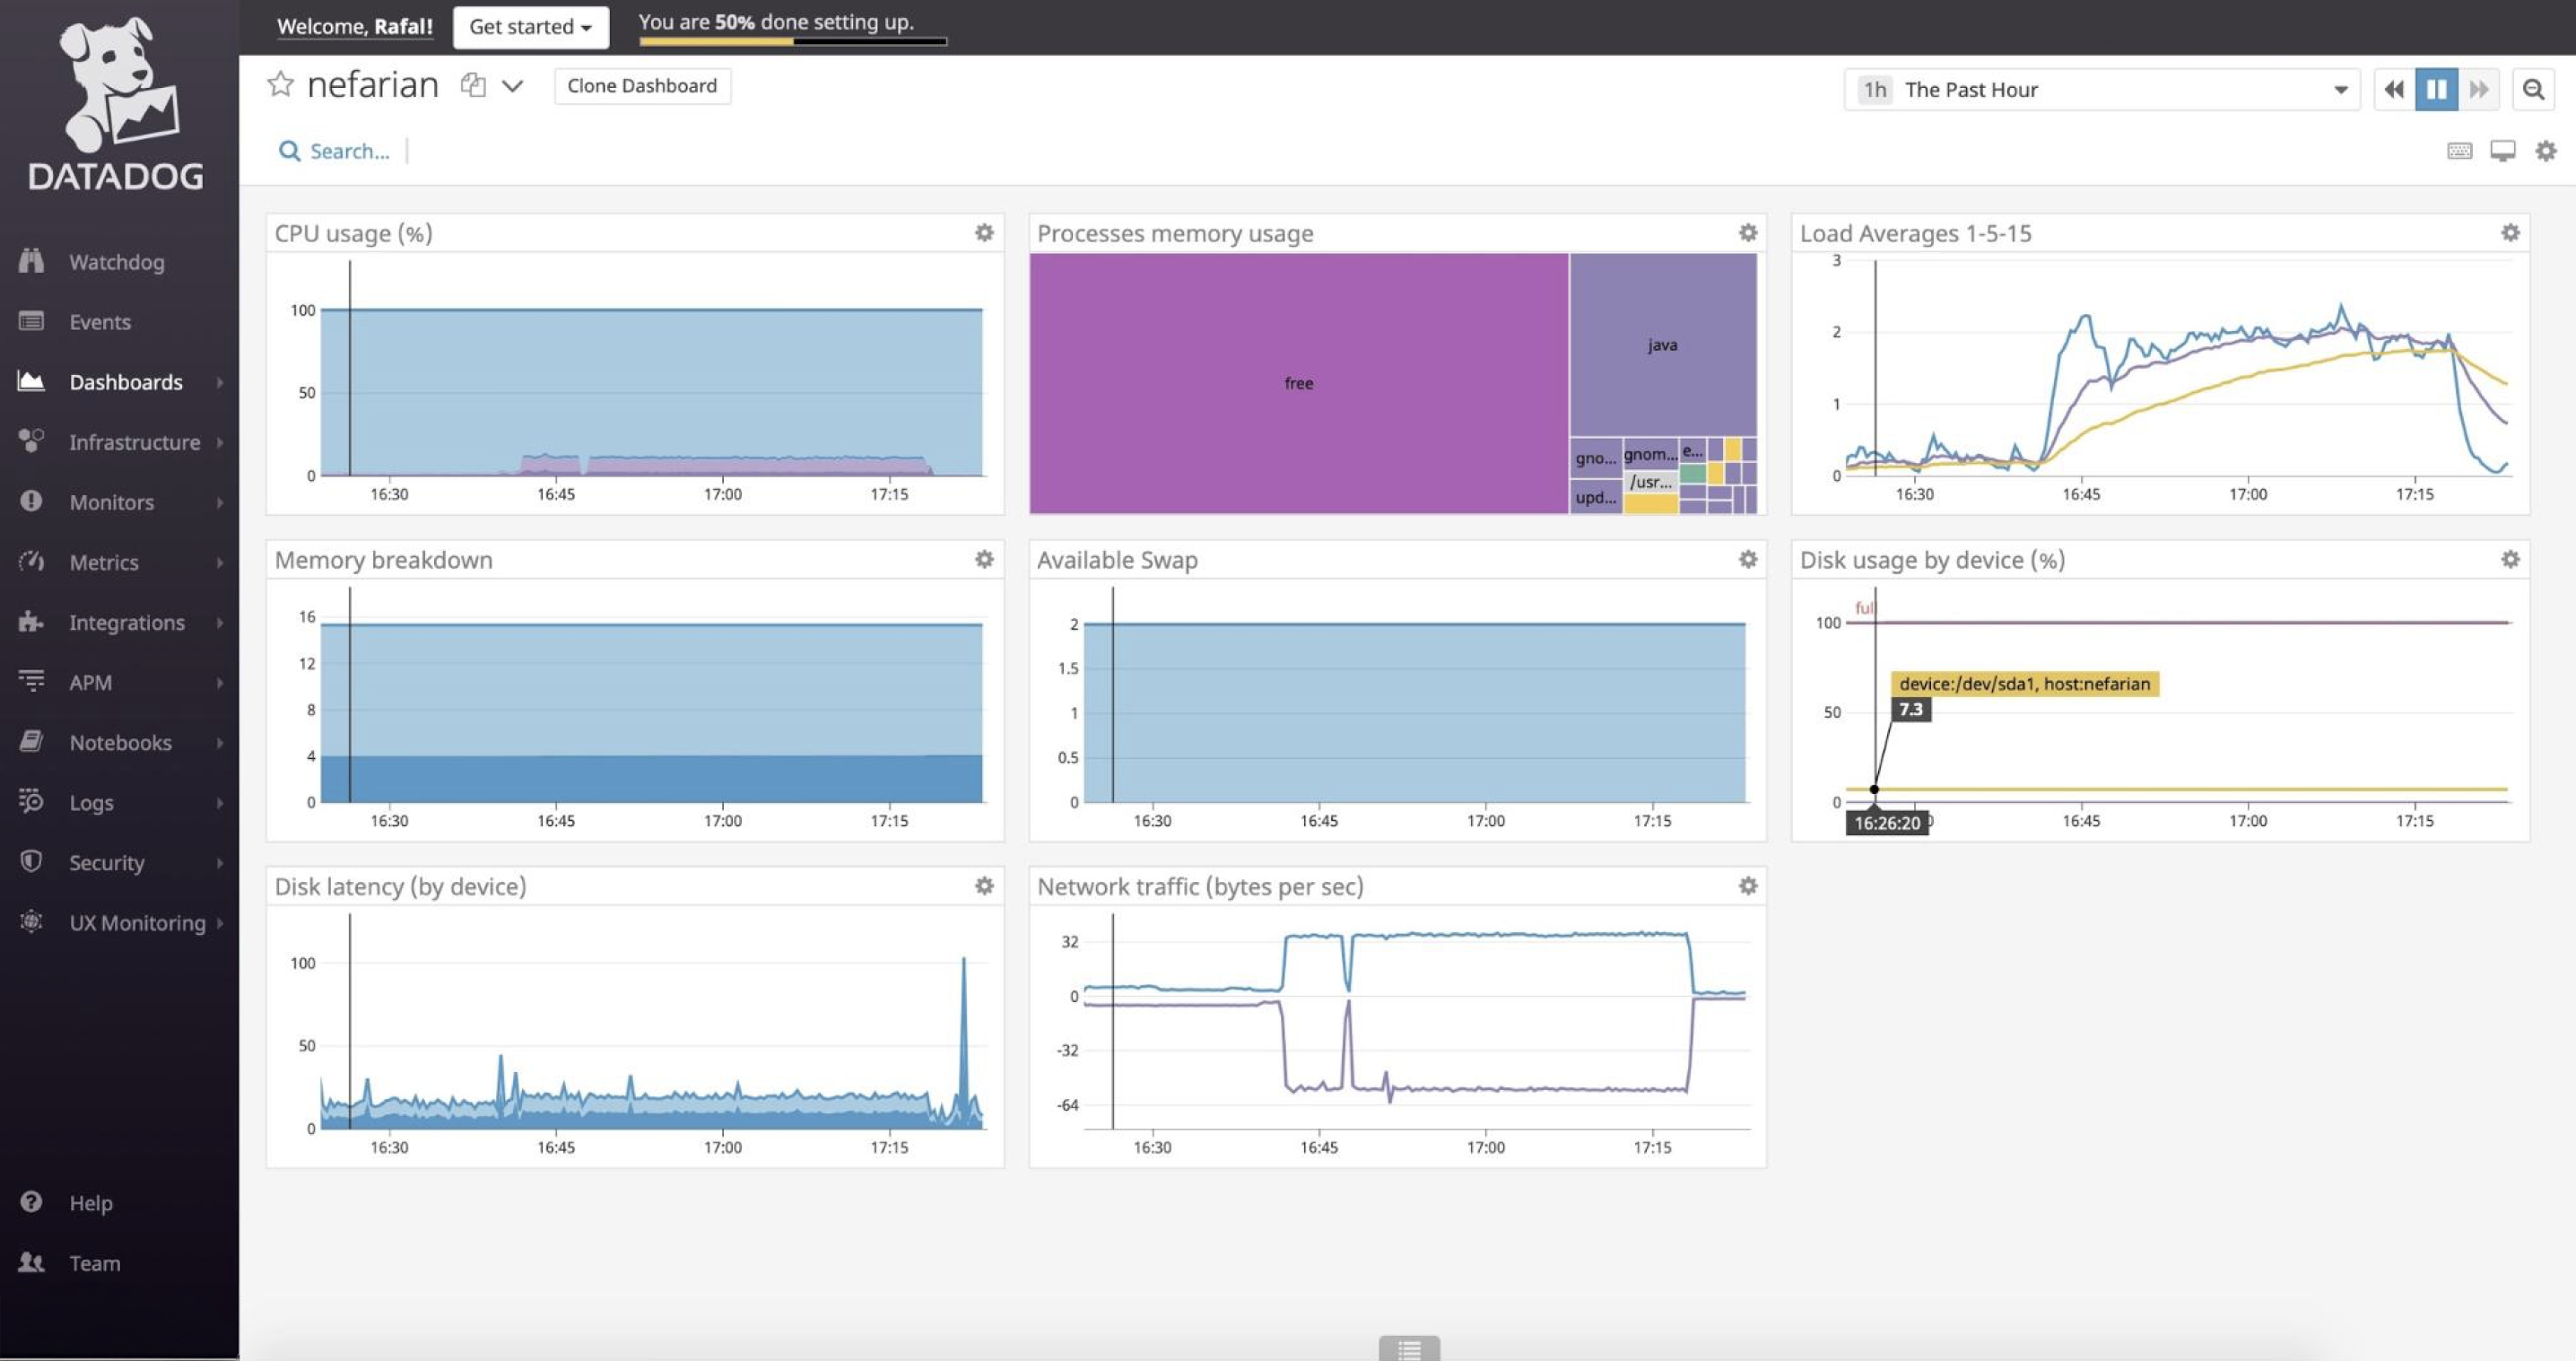
1. Datadog
Datadog is a cloud-based monitoring solution offering comprehensive visibility across infrastructure, applications, logs, and user experiences, with over 400 integrations. Its dashboards are customisable and easy to use, but the breadth of features has a learning curve, and high pricing may deter smaller organisations.
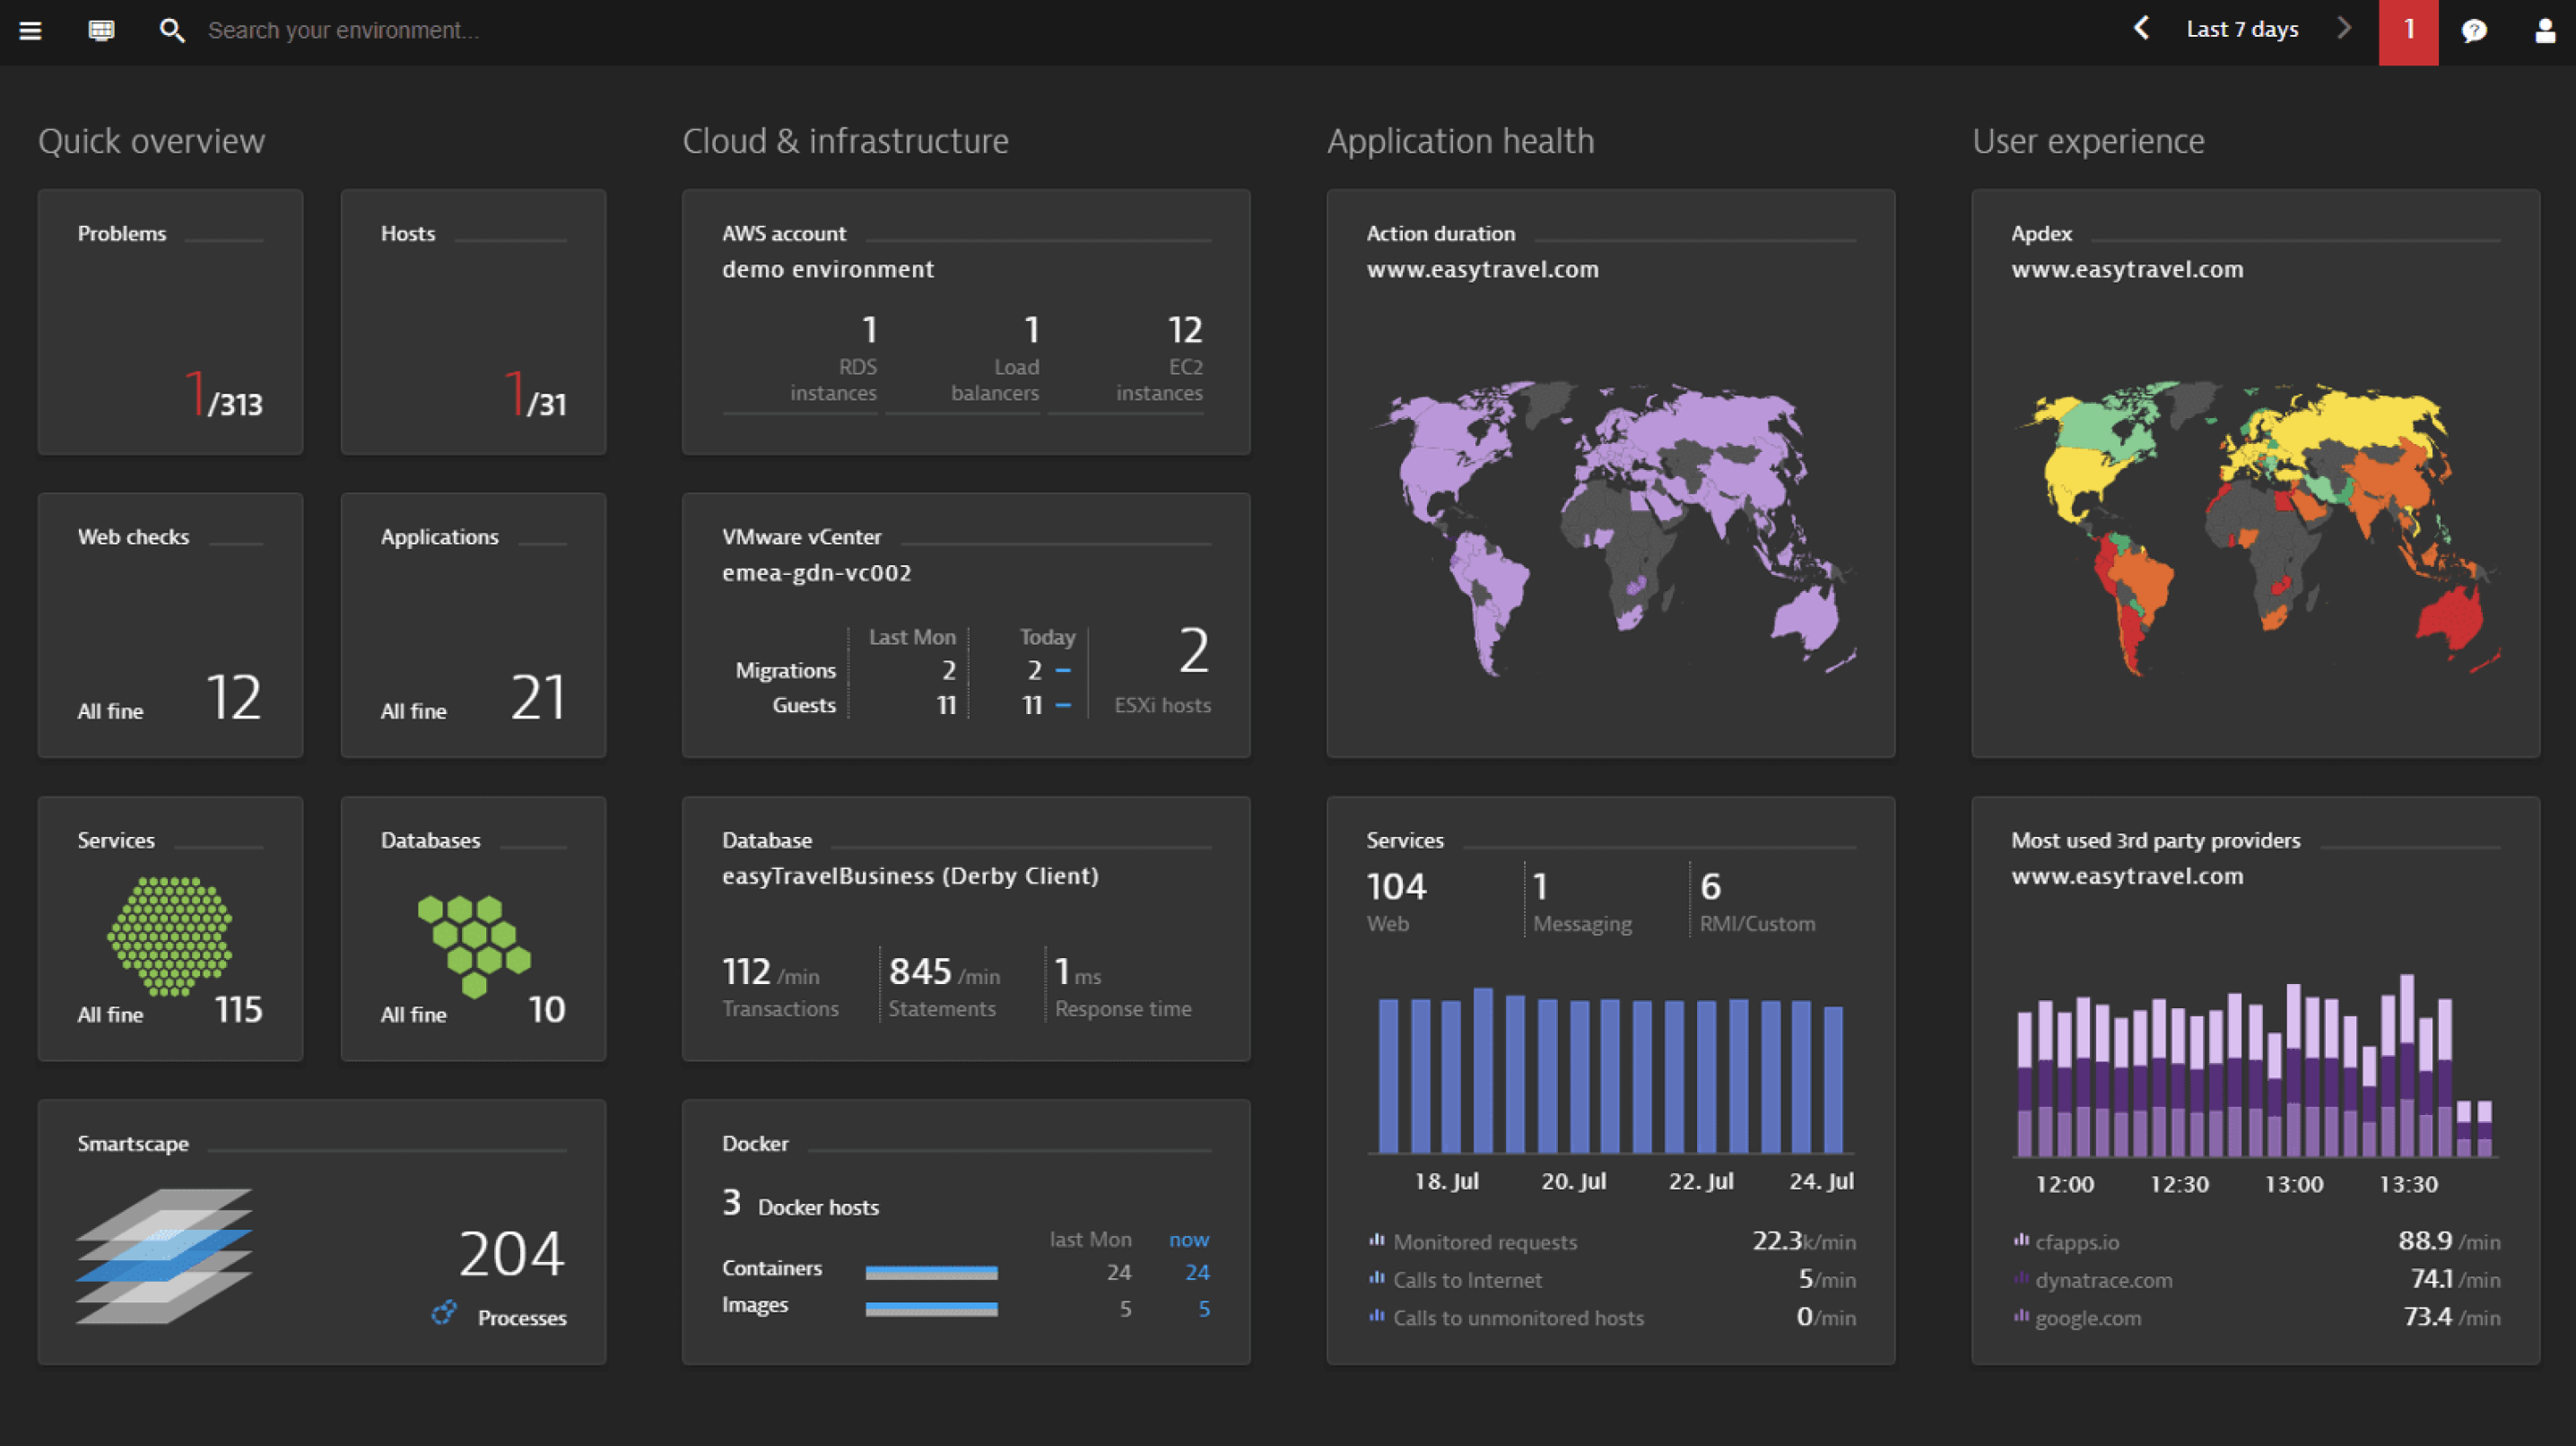
2. Dynatrace
Dynatrace uses AI-driven insights and automation for proactive issue resolution, with advanced observability features like APM, RUM, and topology mapping. Ideal for complex IT environments, Dynatrace is powerful but has a complex setup process and a high price point.
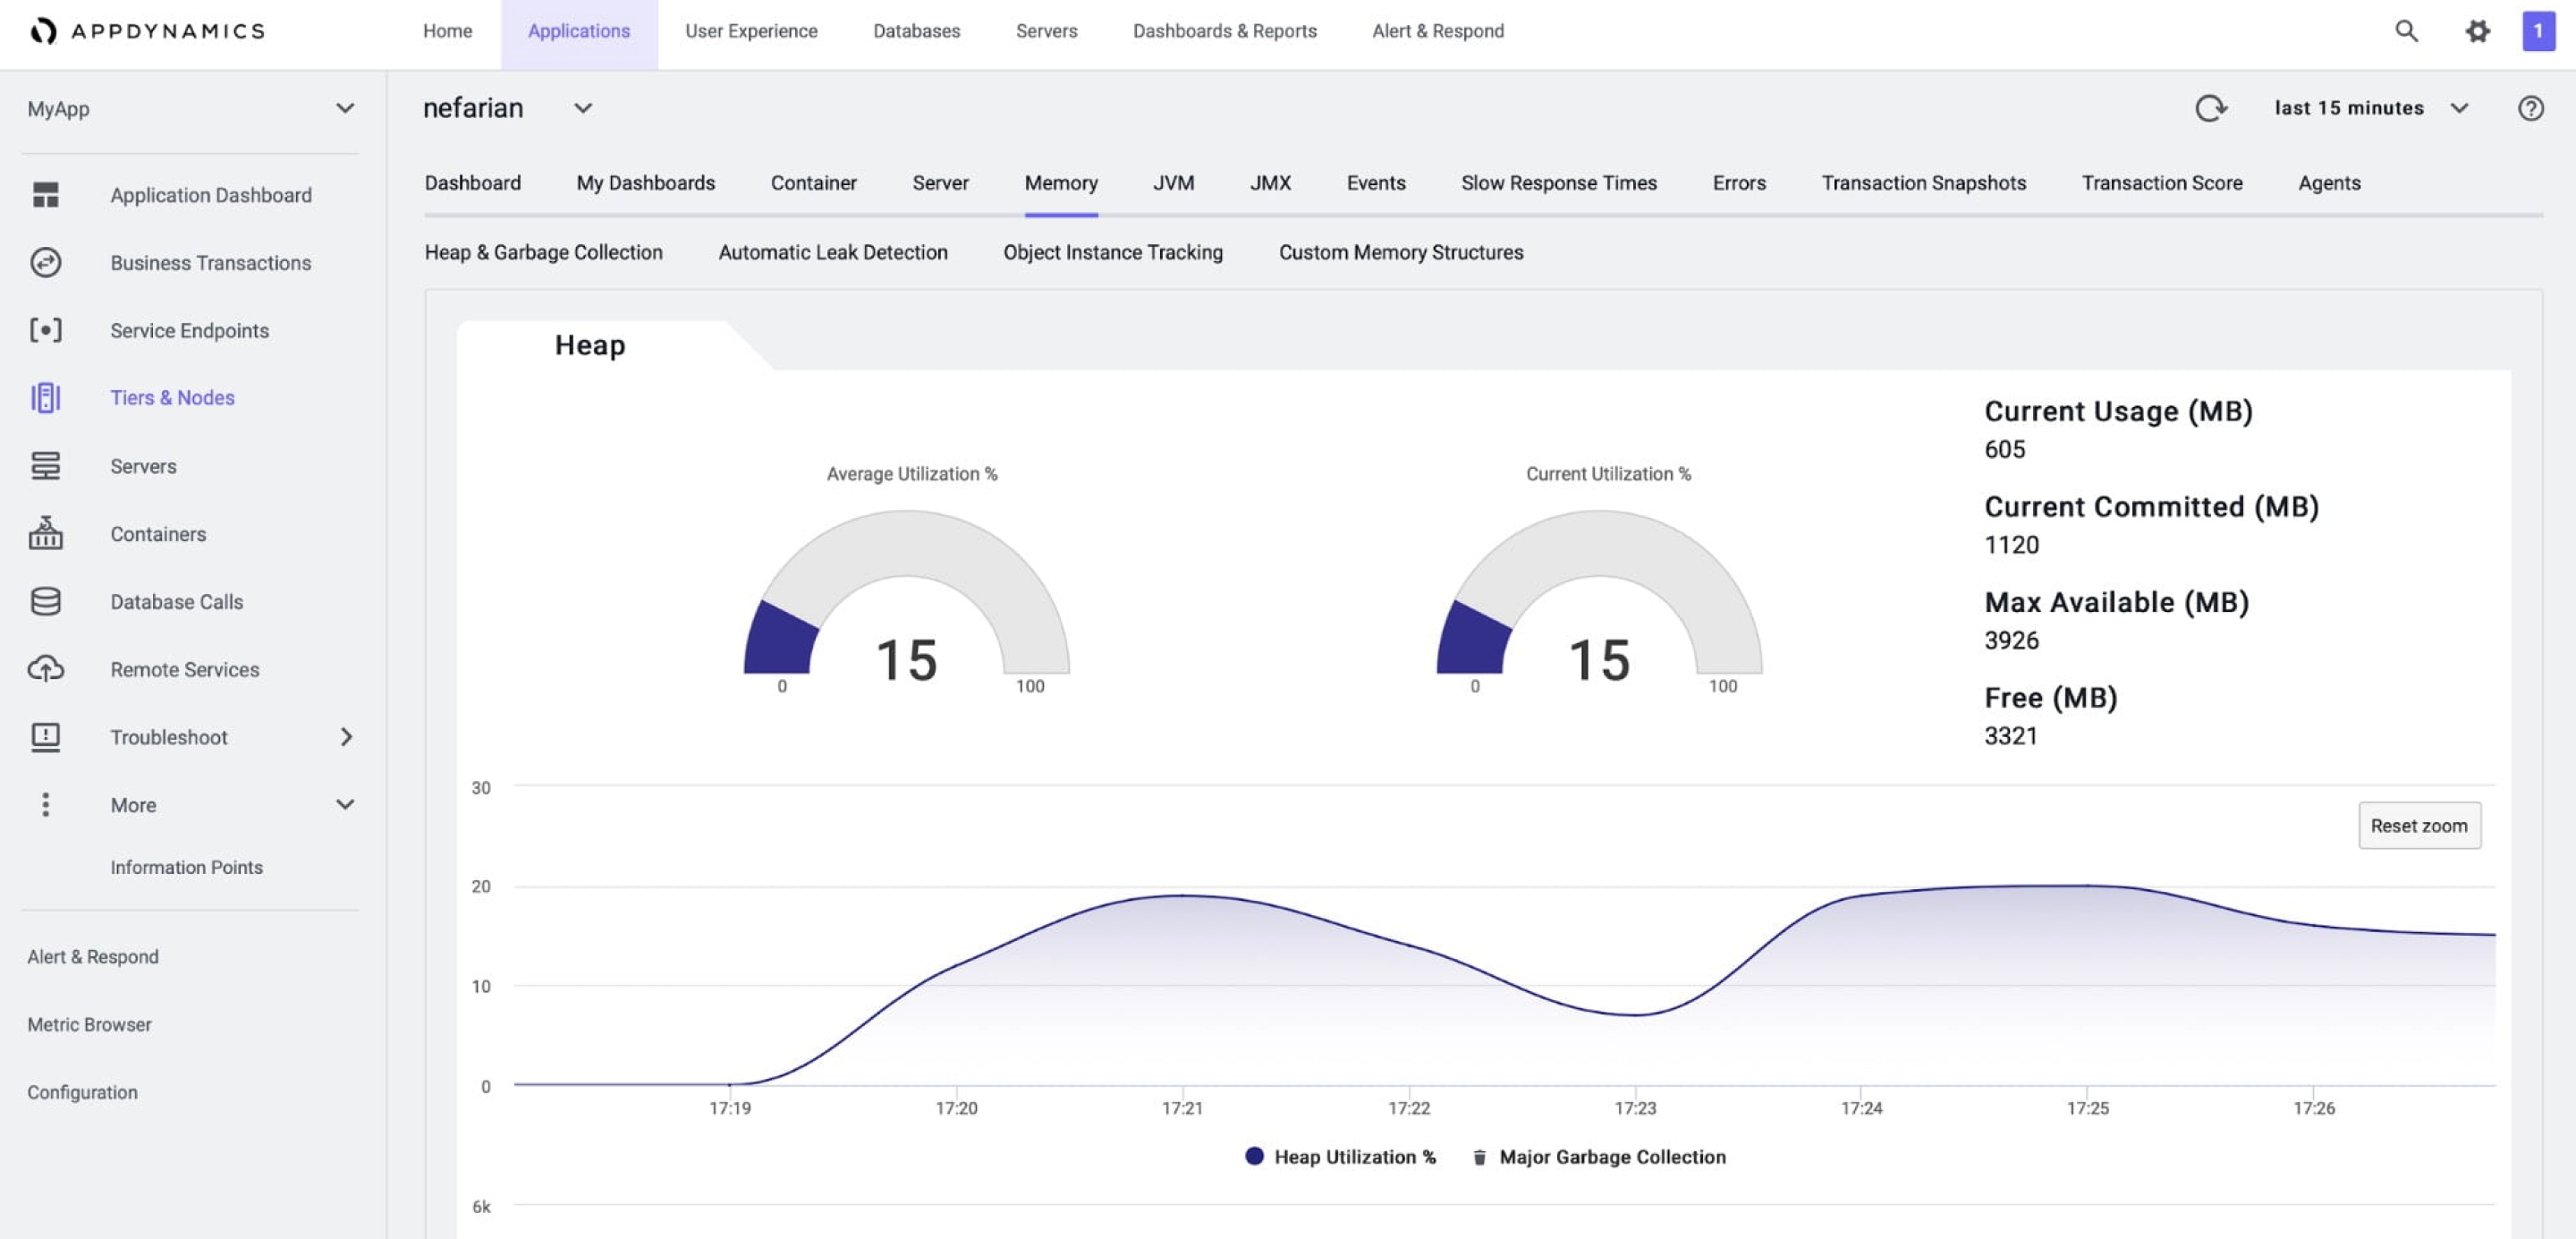
3. AppDynamics
AppDynamics, part of Cisco, focuses on APM with business-oriented insights, including code-level visibility and transaction monitoring. It aligns IT performance with business outcomes, though its infrastructure monitoring is limited, and the interface can be challenging for new users.
4. Sematext
Sematext is an affordable, all-in-one monitoring solution covering infrastructure, logs, RUM, and synthetic monitoring. Its straightforward dashboards make it accessible, though a smaller integration ecosystem and lack of advanced features may limit its use in complex setups.
| Feature | Nutanix Prism (xAnalysis) | Datadog | Dynatrace | AppDynamics | Sematext |
|---|---|---|---|---|---|
| Infrastructure Monitoring | |||||
| Application Performance Monitoring (APM) | |||||
| Log Management | |||||
| Real User Monitoring (RUM) | |||||
| Synthetic Monitoring | |||||
| Machine Learning-Based Alerts | |||||
| Code-Level Visibility | |||||
| Container Monitoring | |||||
| Predictive Analytics | |||||
| Topology Mapping |
Key observations
Where xAnalysis stands and the road ahead.
Nutanix Prism’s xAnalysis focuses on infrastructure monitoring but lacks more advanced features like real user monitoring (RUM), synthetic monitoring, and machine-learning-based alerts. Its smaller integration ecosystem also limits how well it works alongside other tools.
Datadog, Dynatrace, AppDynamics, and Sematext all offer more complete monitoring. Datadog leads with over 400 integrations and broad coverage across APM, RUM, synthetic monitoring, and machine learning alerts. Dynatrace stands out for its AI-driven insights, predictive analytics, and topology mapping, which suit complex IT environments. AppDynamics pairs application monitoring with business-oriented insights, while Sematext offers flexible pricing and a balanced feature set.
For xAnalysis to keep up, it needs APM, RUM, synthetic monitoring, and machine-learning-based alerts. A wider set of integrations would help too.
Converging avenues
Narrowing things down.
About a month into the internship, I realised I needed to prioritise and settle on one specific thing to improve in Prism.
There were plenty of problems and opportunities, but with a limited timeframe I had to pick a focused scope to actually make progress.
Advanced Monitoring Capabilities
Customisable APM and RUM dashboards with modular components for metric selection, thresholds, and widgets could enhance usability by providing flexibility and control over performance monitoring.
Visual Representations with Topology Mapping
Topology views can offer admins a clear understanding of infrastructure dependencies, aiding in multi-point issue identification and impact assessment.
Mobile Integration for On-the-Go Monitoring
A mobile app or responsive interface for xAnalysis would enable remote monitoring, real-time alerts, and incident response, ensuring seamless infrastructure visibility and control.
Forecasting Dashboard
Forecasting capabilities with intuitive visualisations can predict resource trends, optimise performance, and aid in proactive capacity management, enhancing resource allocation efficiency.
Improved Alert Consolidation Interface
A redesigned alert interface with grouping, filtering, and customisation options can streamline incident resolution, reduce noise, and prioritise critical issues effectively.
Converging on Improved Alert Consolidation
A well-received direction.
After my mid-internship presentation, the design team liked the analysis and the recommendations, which gave me more confidence in the direction.
The alert consolidation idea drew the most interest. Better alert management was something customers kept asking for, and it lined up with the team’s roadmap for xAnalysis, so it was an easy one to back.
With that encouragement, I spent the final phase of the internship on this feature, building a cleaner interface that could cut through the noise admins were dealing with.
The Final Designs
Introducing the Problems Page.
The final designs centred on a dedicated Problems page for alert consolidation. It gave admins one place to manage alerts, cut down the noise, and focus on the issues that mattered.
It added grouping and filtering, customisable priority settings, and a layout that let admins find and resolve the pressing problems quickly.
The Problems page used Nutanix’s design system, so it stayed consistent with the rest of the platform. For alert management, it was a real step forward.
The problems page
A consolidation of multiple issues under 1 collective 'problem'. This reduces the amount of alerts and in turn reduces analysis paralysis. It gives the exact info on which are the affected entities and shows the severity too. Recommendations based on those alerts give the admin a way to actually solve each problem. They can also click on 'Add to Analyse' to do a deeper RCA, view the different charts for clusters which are causing this issue, and finally mark it as 'Resolved' if the issue is fixed.
Quick-add
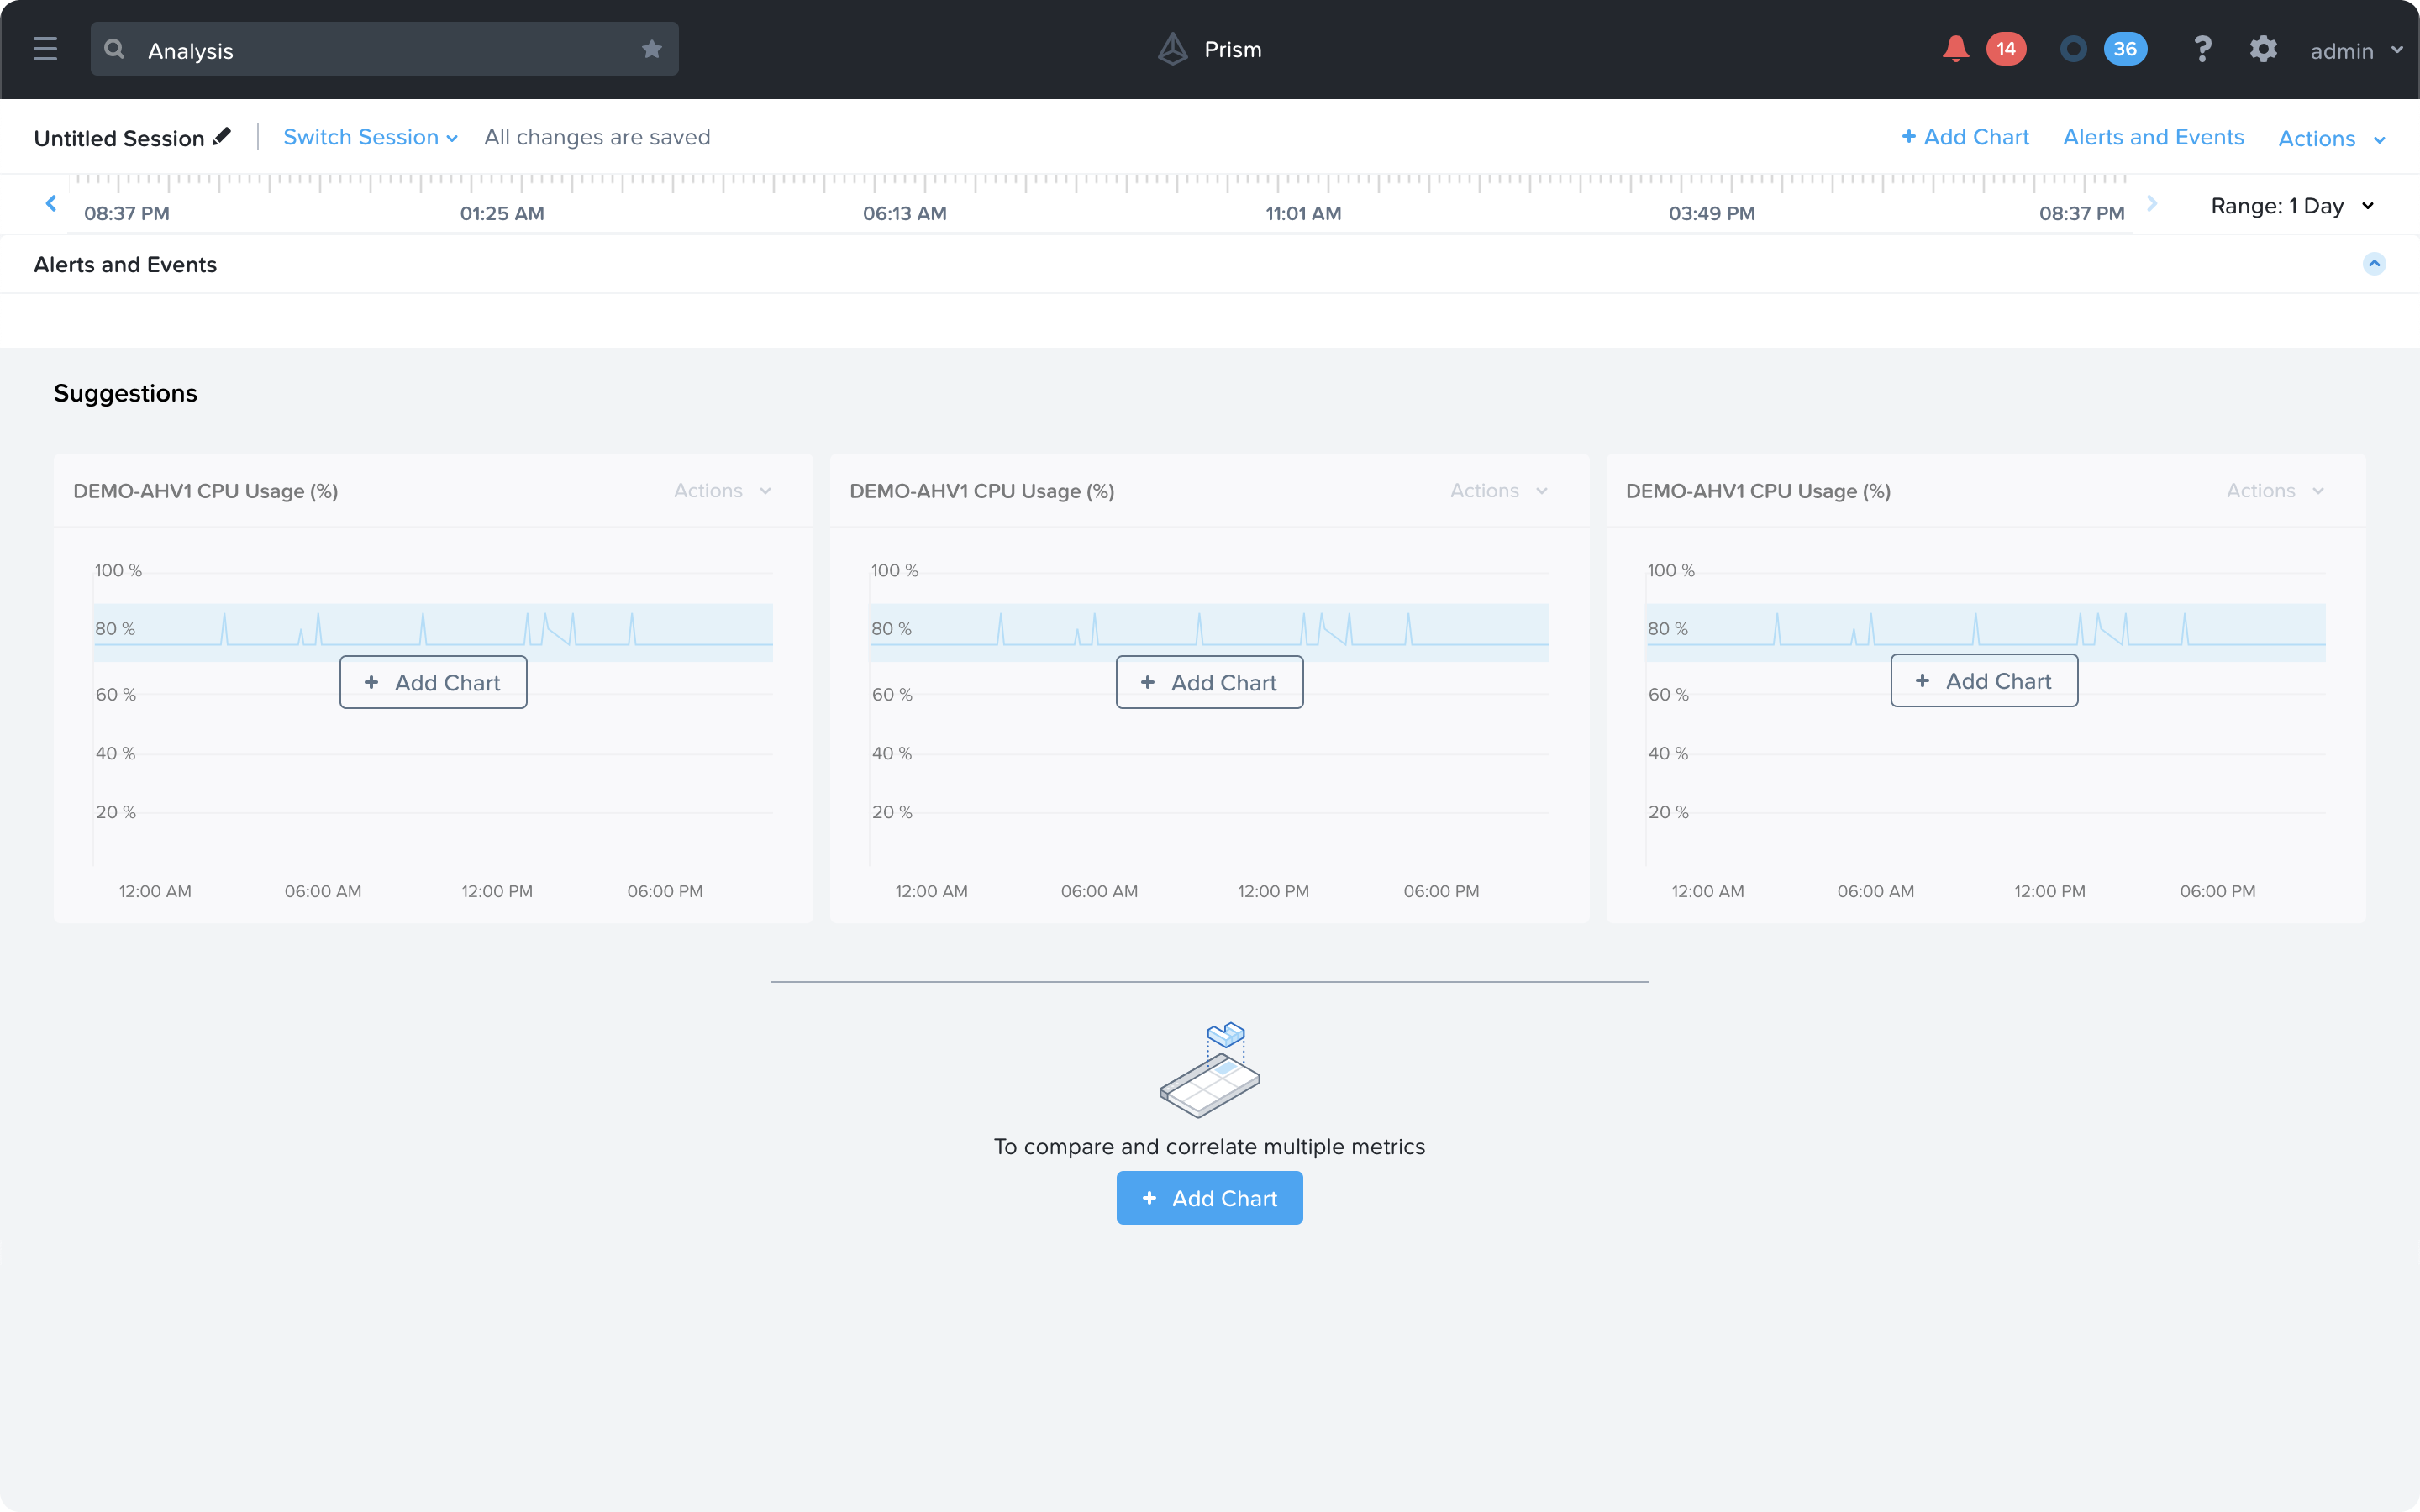
Among the collection of minor features that I proposed, the quick-add feature for Charts to the Analysis page was one of the most well-received. This gives suggestions to the user based off of the 'Problems' which are currently active, or were recently marked as Solved. It can also take cues from the name or description of the Analysis session.
Adding granularity
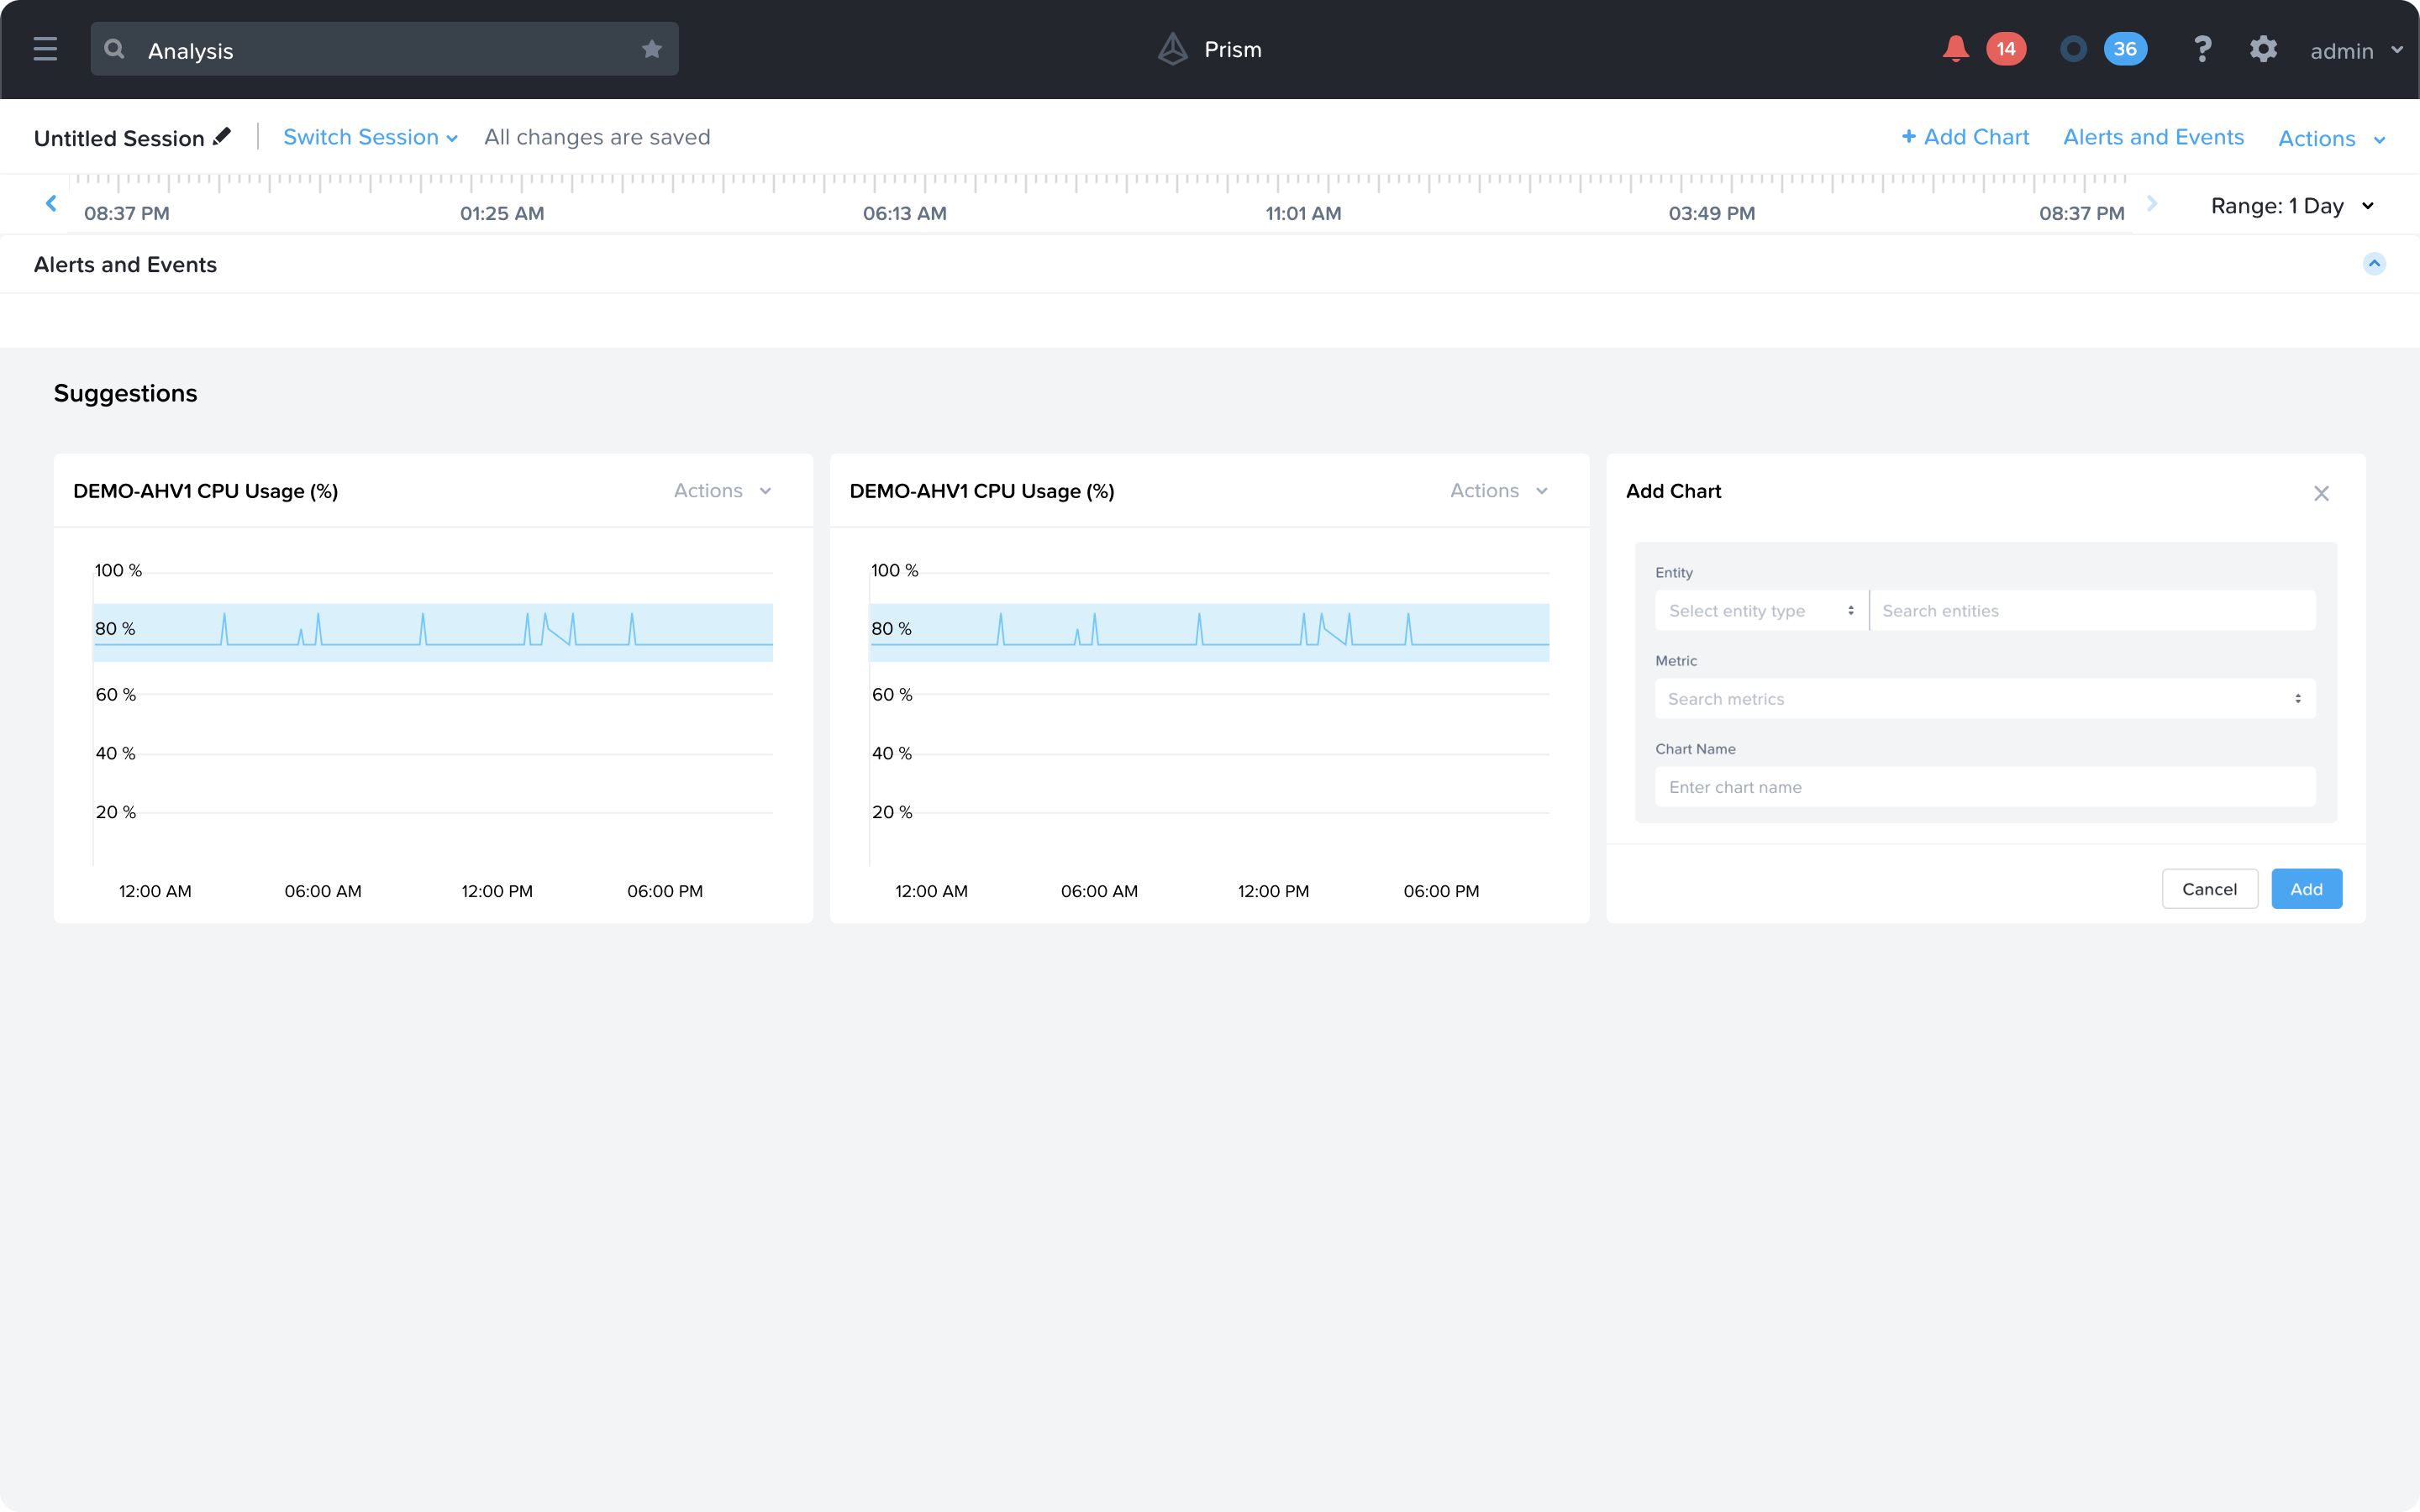
The old design popped a modal every time the user wanted to add a chart, which pulled their focus away from the Analysis session they were in. The new design lets them add charts straight from a dropdown, which is quicker and easier.
Critical alerts
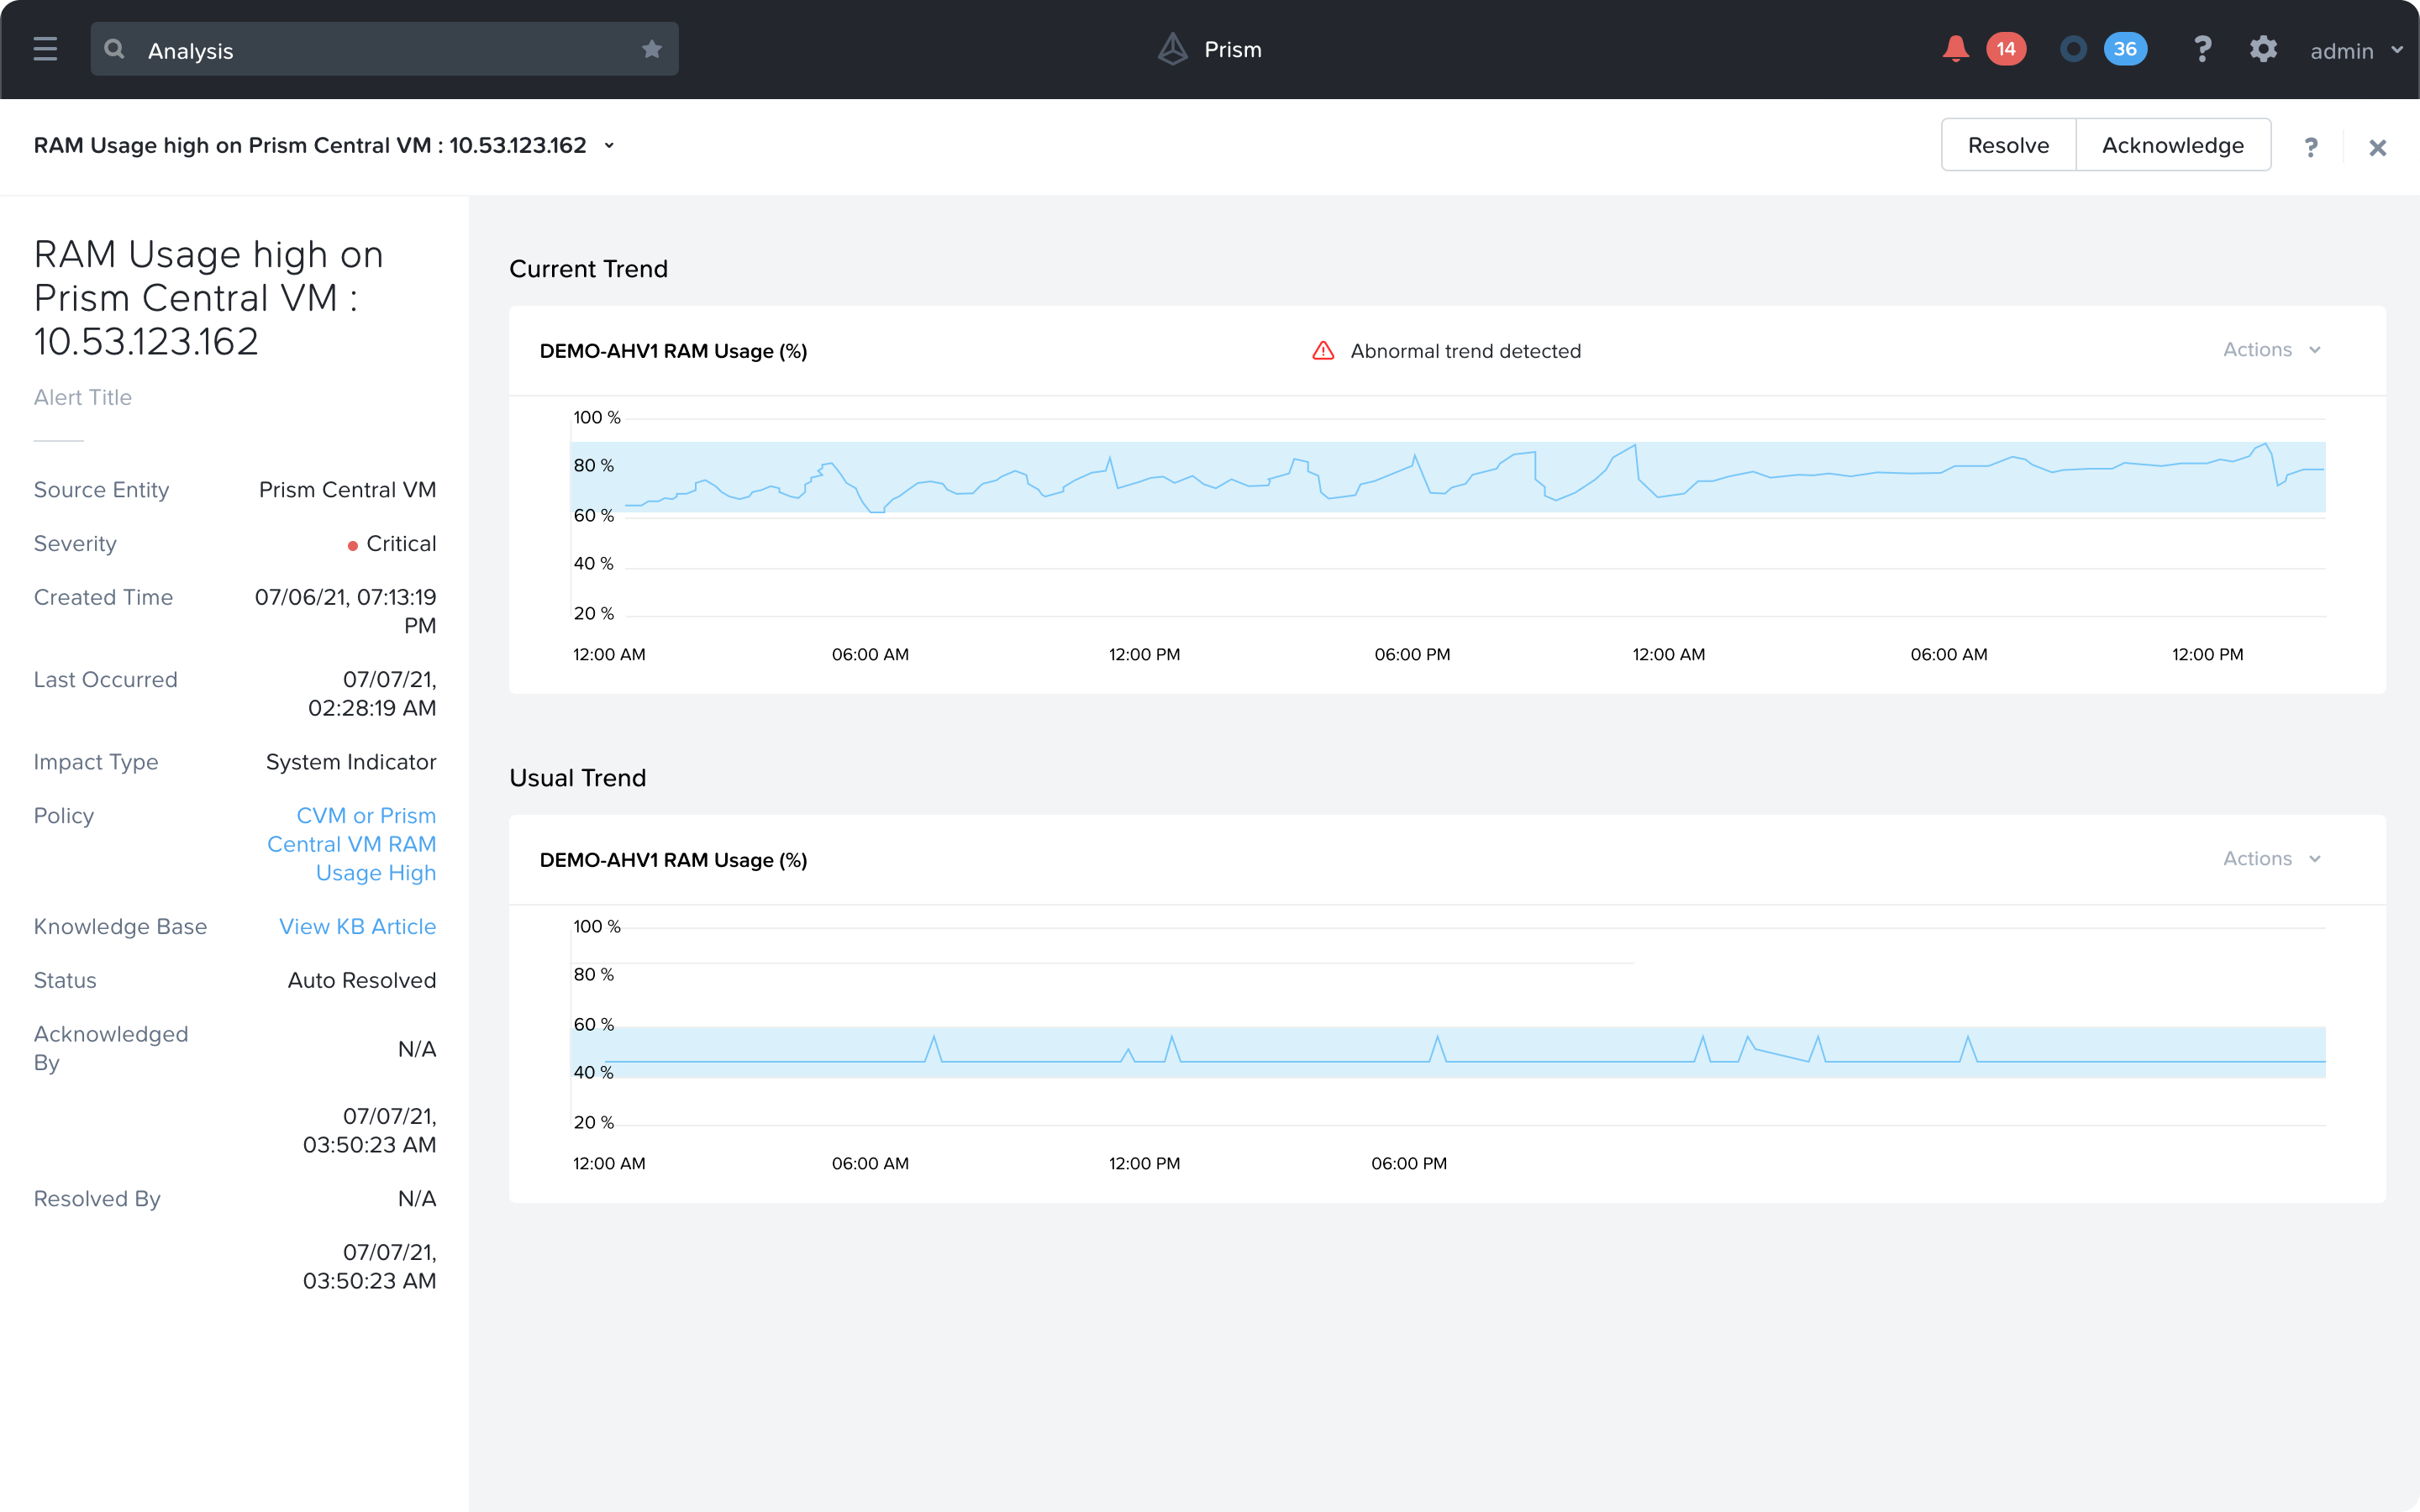
Every alert can show a Trend or a Metric which is causing that issue. One of the concepts I presented also included an addition of a 'Abnormal trend detected' warning which lets users know that this Metric usually doesn't take this form. This makes it easier to track what's going wrong in a Problem analysis page.
What did I learn from this?
What my first proper industry stint taught me.
This was my first real look inside enterprise IT, and how much complexity sits behind hybrid infrastructure monitoring, plus how teams actually work in a large organisation. Working across time zones also pushed me to get better at async communication and managing what people expected by when.
I had setbacks too, and honestly those taught me more than the wins did. It was the first time I really learned to sit with something not working and keep going at it.