Bringing Copilot to enterprise analytics
The short version.
Viva Insights is Microsoft's people-analytics platform, used across enterprises to surface productivity and wellbeing trends. Its power users are data analysts who build custom queries, but the manual, multi-step builder buried them in hundreds of metrics, filters, and attributes.
I owned the design of Copilot for the custom query-building experience, from early research through to the shipped GA release, working with a PM, engineering, and user research across time zones. The goal was to let analysts describe what they want in plain language and get the right metrics, filters, and a runnable query in a single step.
Since launch in January 2025, it cut query setup from around 30 minutes to under 15 seconds, drove roughly 200% growth in active users, and shifted analysts towards building their own custom queries, with about 20% now submitted straight from Copilot without any edits.
Clearing the fog
Where analysts get stuck today.
Analysts on our platform run queries to generate reports, which inform productivity and wellbeing strategies across the organisation.
The catch is that building one means working through hundreds of metrics, filters and attributes by hand. It is slow and easy to get lost in, so discoverability was low and analysts often left a query half-finished. When they did get through it, a single query took around 30 to 60 minutes to set up.
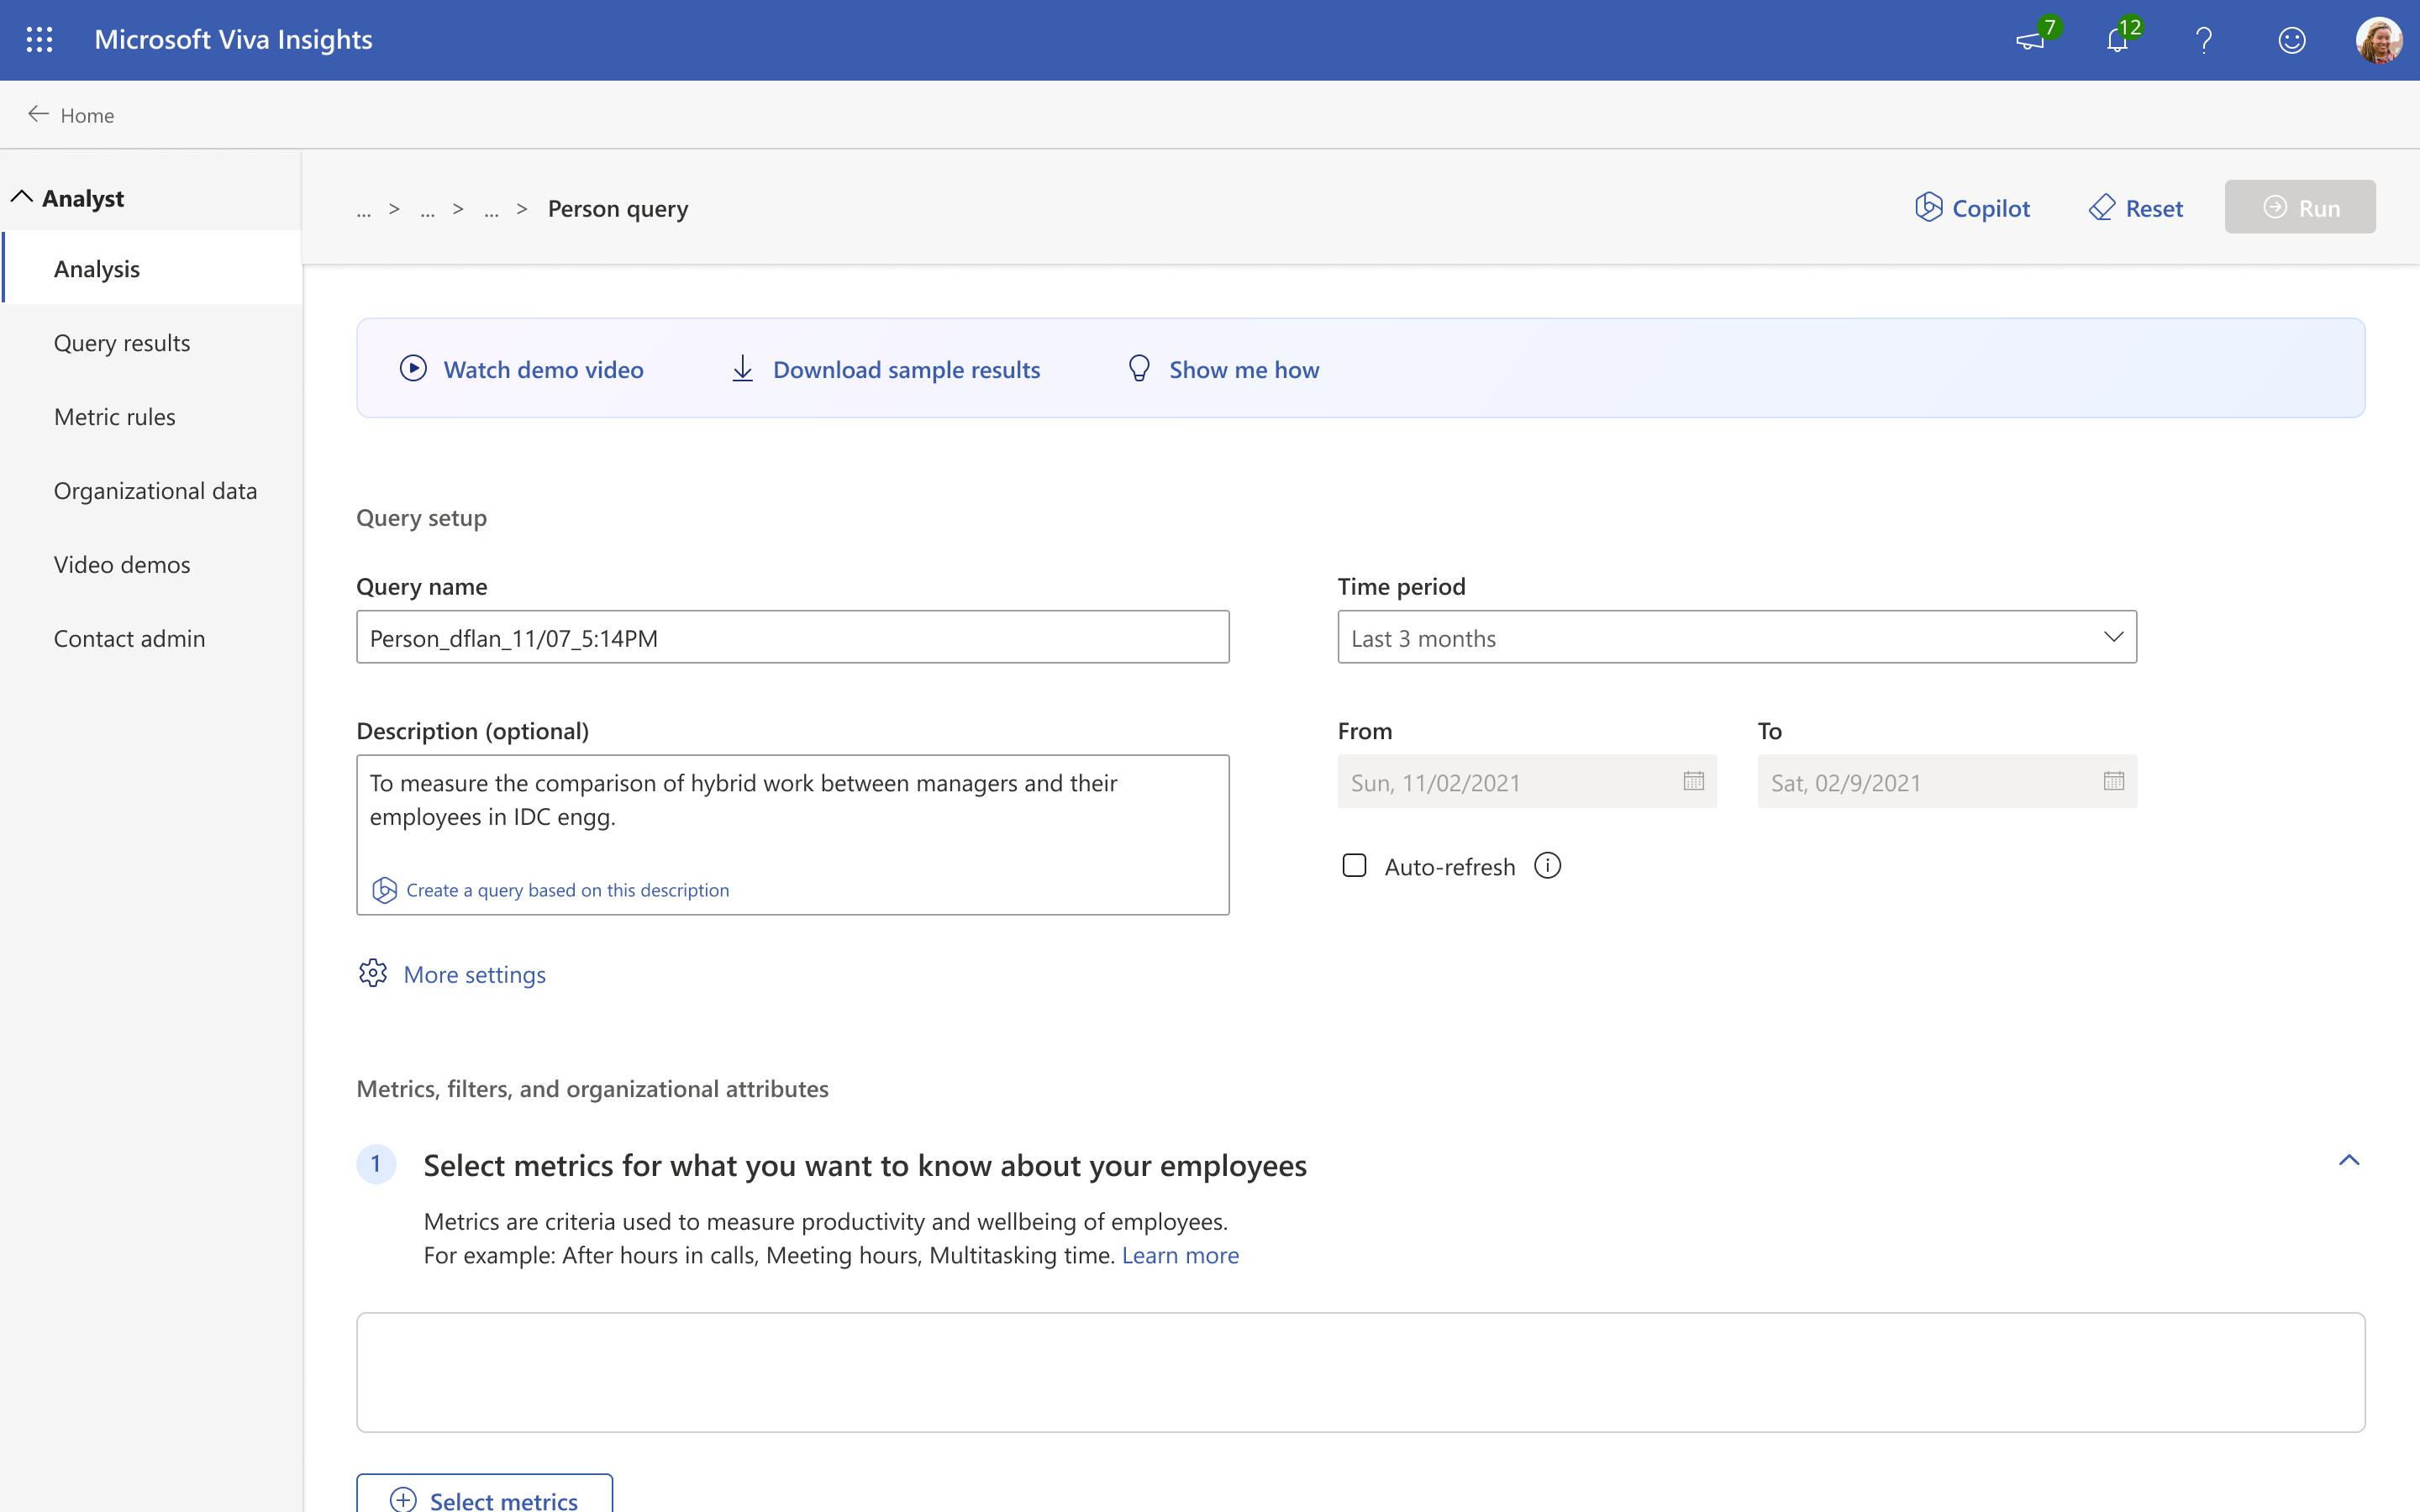
The idea behind Copilot was simple: let analysts write what they want to understand, and have the system suggest the right metrics and filters as they go. The current builder has three main steps.
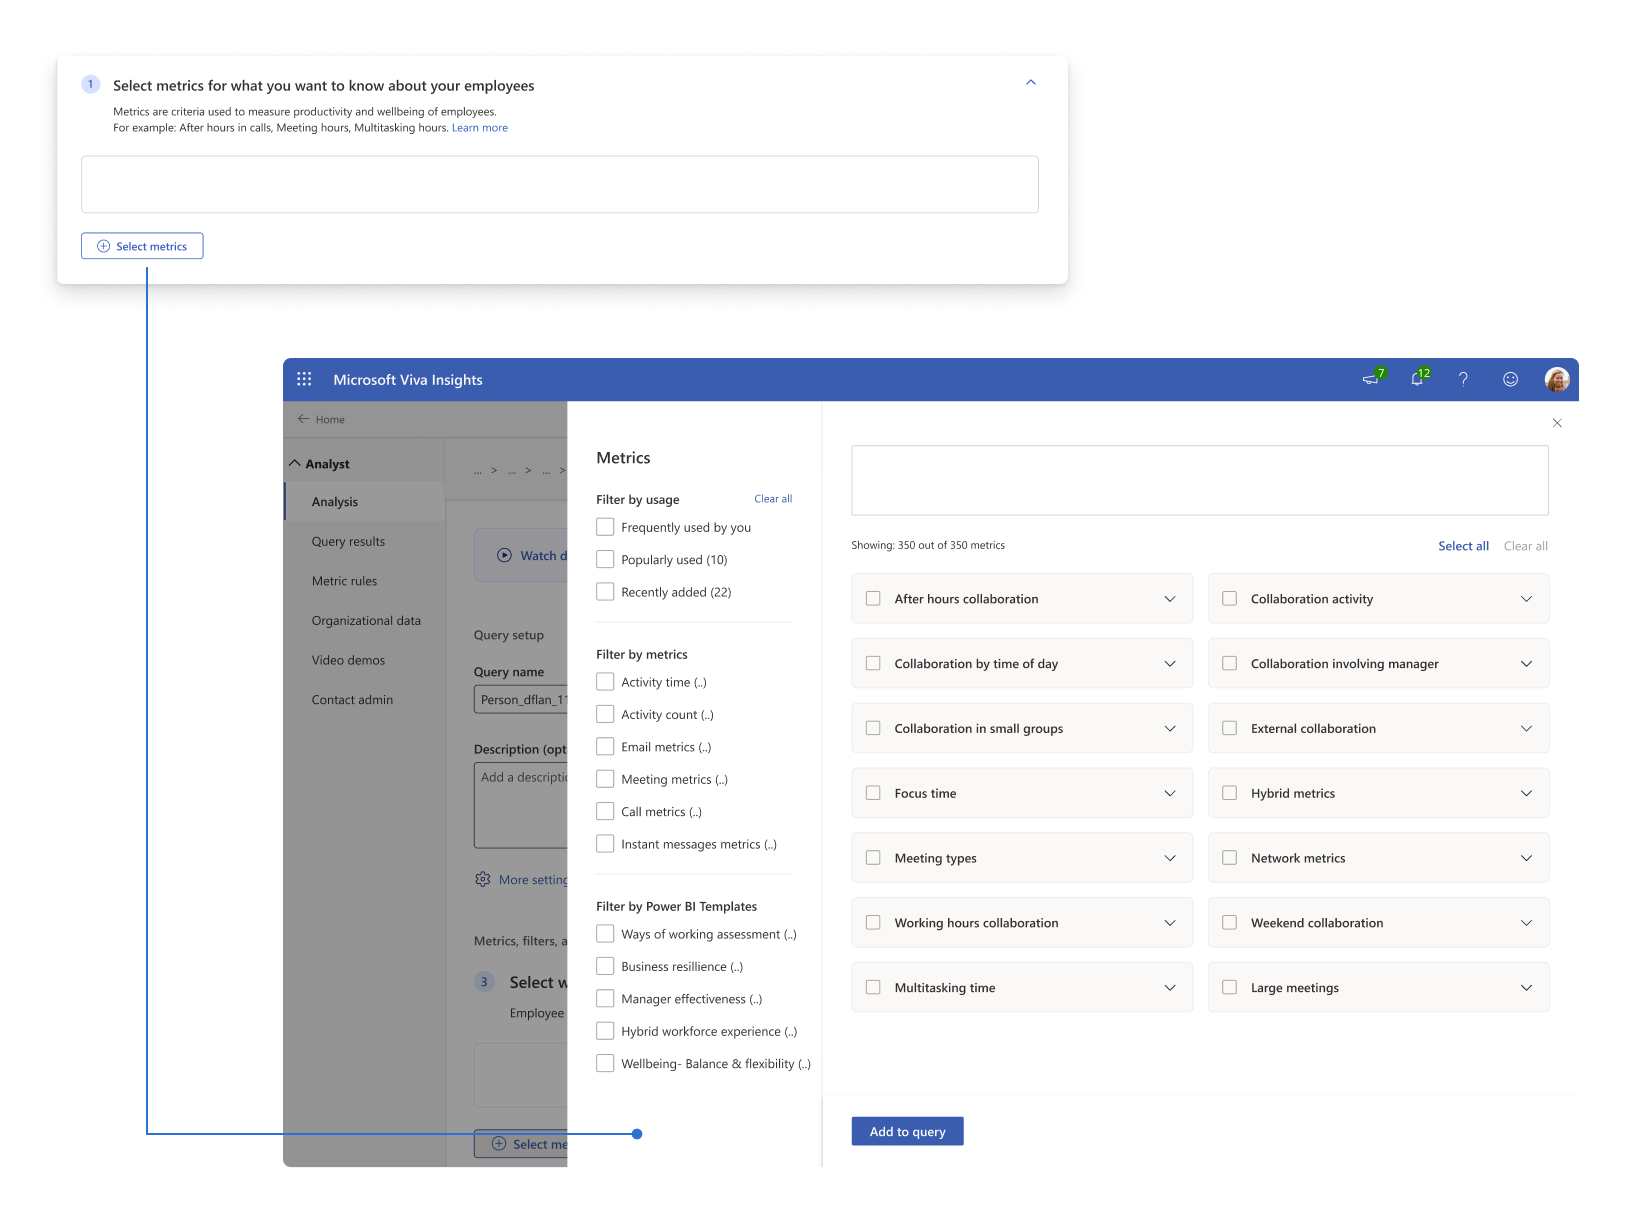
1. Selecting Metrics
Metrics are criteria which are used to measure productivity and wellbeing.
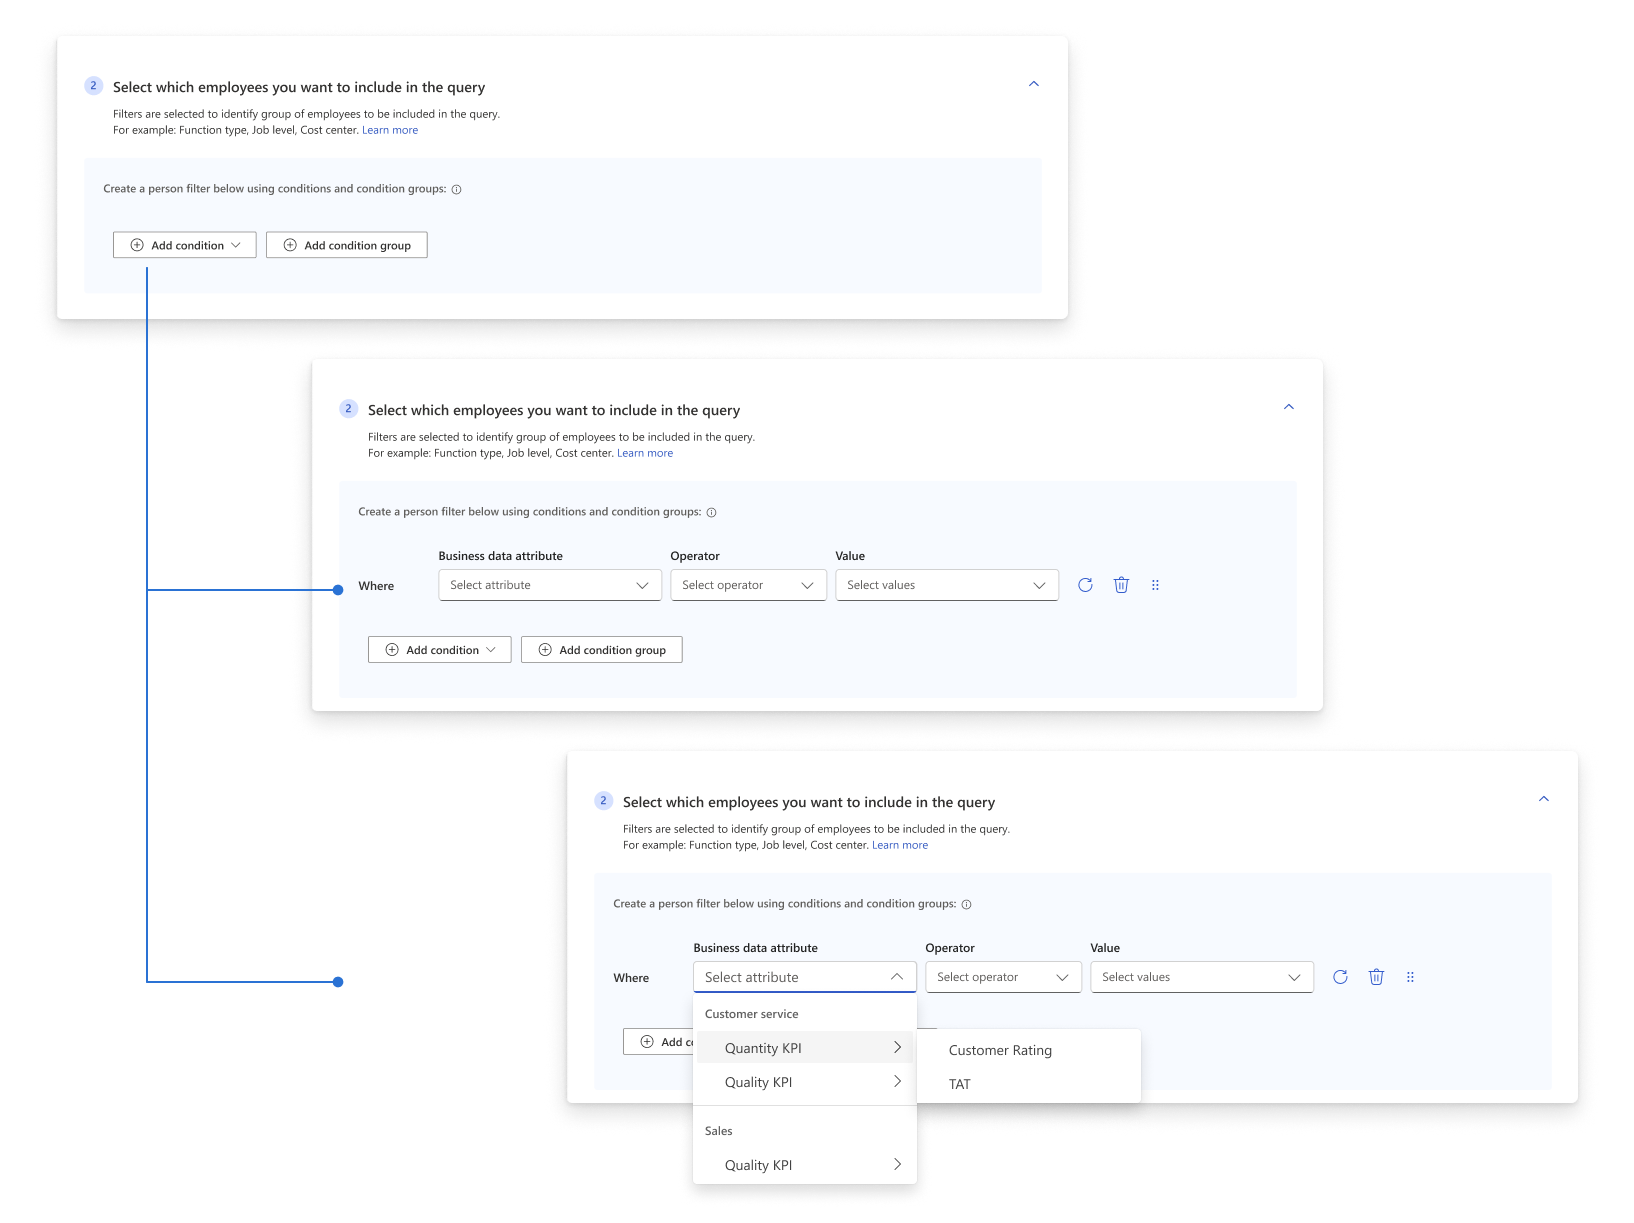
2. Applying Filters
This allows us to narrow down the employees to run the query for.
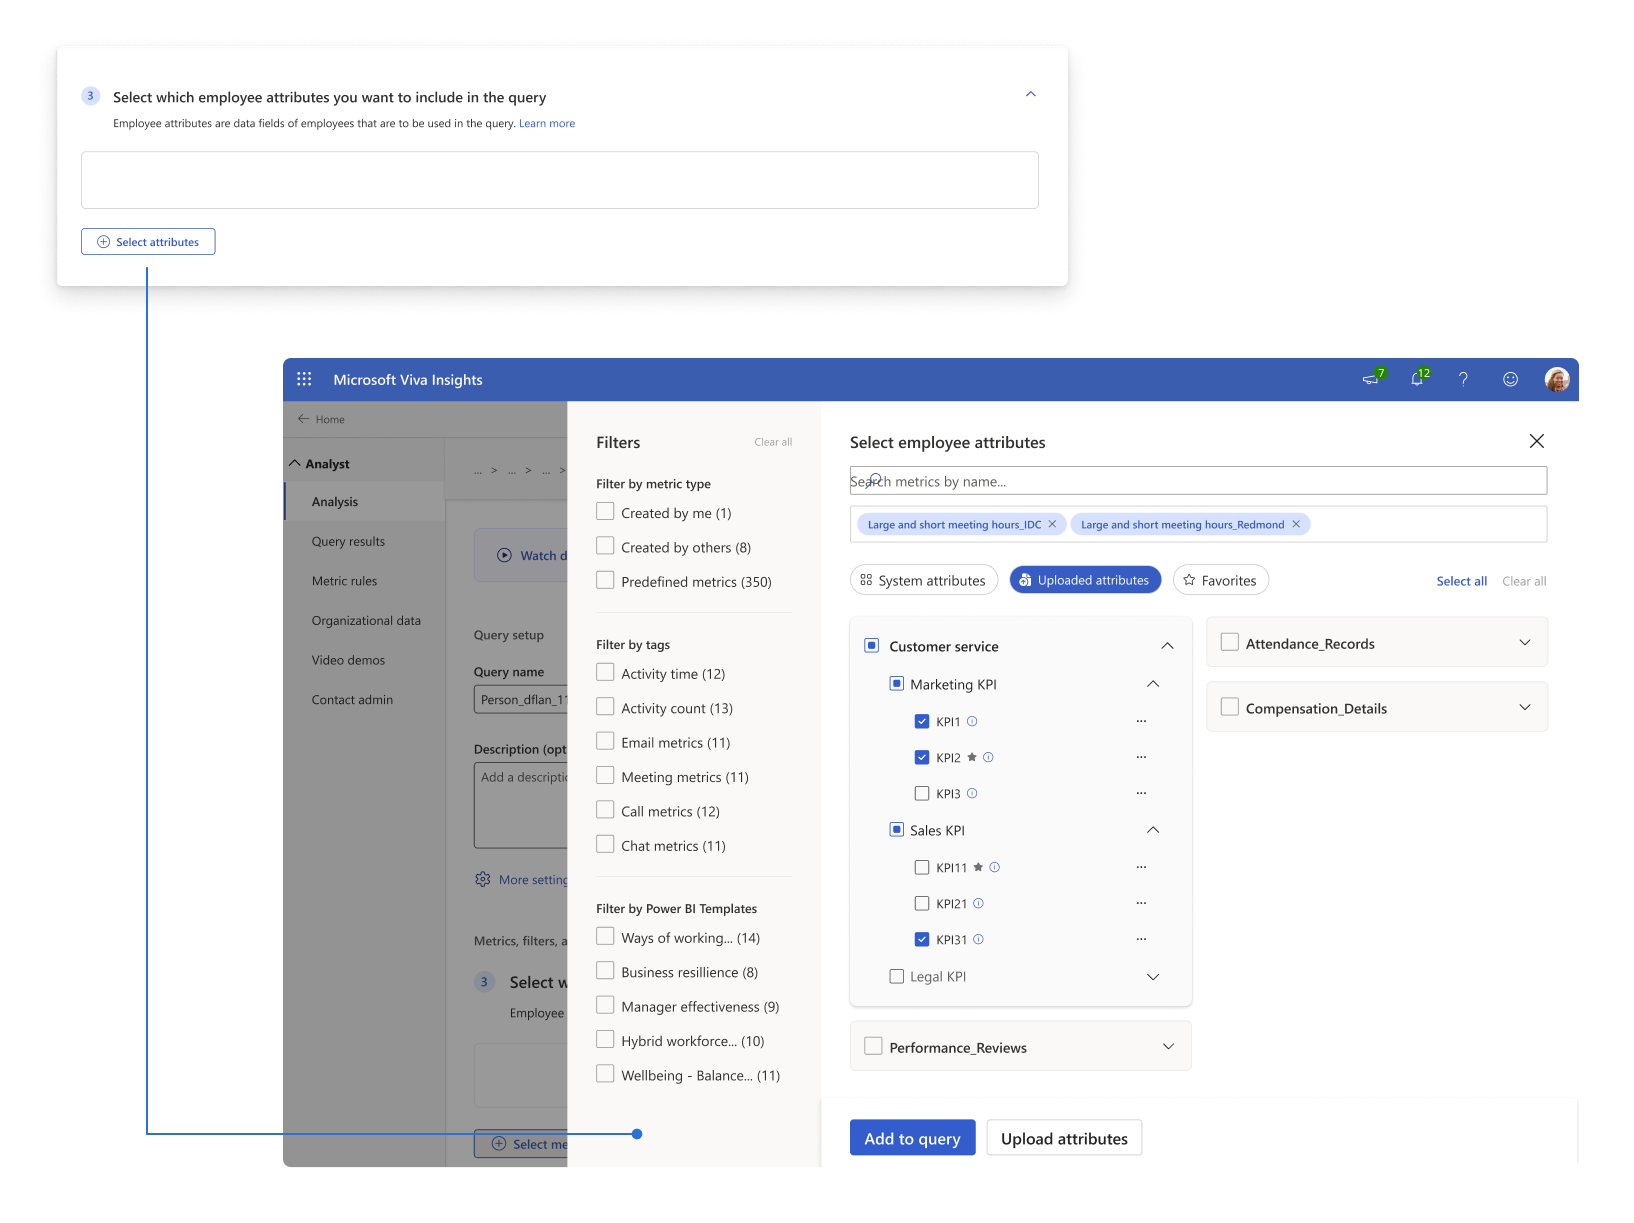
3. Selecting Attributes
Attributes are data fields of these employees who are being measured.
Diving deep into how a query is run
Mapping how analysts actually run a query.
Running a query takes an analyst through several steps, and the friction adds up: they define the query, pick metrics, apply filters, then switch to a separate tool to see the results.
Analysis Paralysis
With hundreds of metrics and attributes, both new and experienced analysts can feel overwhelmed. The lack of contextual cues or suggestions compounds complexity, increasing time to completion.
Lack of Guidance
Documentation is helpful but external. Without integrated support, analysts must rely on memory or guesswork to select suitable metrics and filters.
Steerability & Trust
Without transparency or rationale for metric suggestions, analysts hesitate to trust automated recommendations.
Siloed Experience
Once queries are set, results open in separate visualisation tools (e.g., Power BI). Switching between systems disrupts focus, slowing down analysis and insight generation.
What about our competition?
How others have tackled this.
I looked at how a few of the leading analytics tools handle AI-driven assistants and query building:
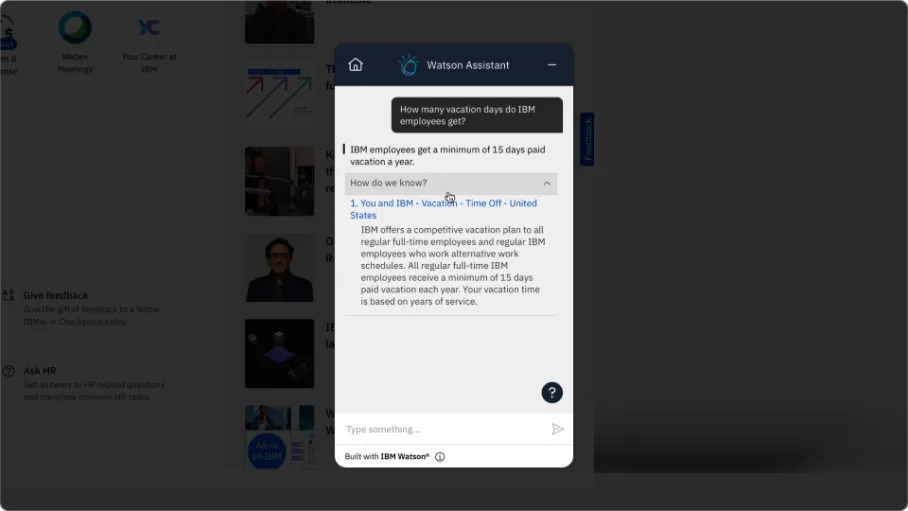
1. IBM Watson Analytics Assistant
Watson offers chat-based analytics with contextual suggestions and citations, which help build trust. It can feel a bit too “wizard-like” though, and tends to oversimplify the more advanced steps.
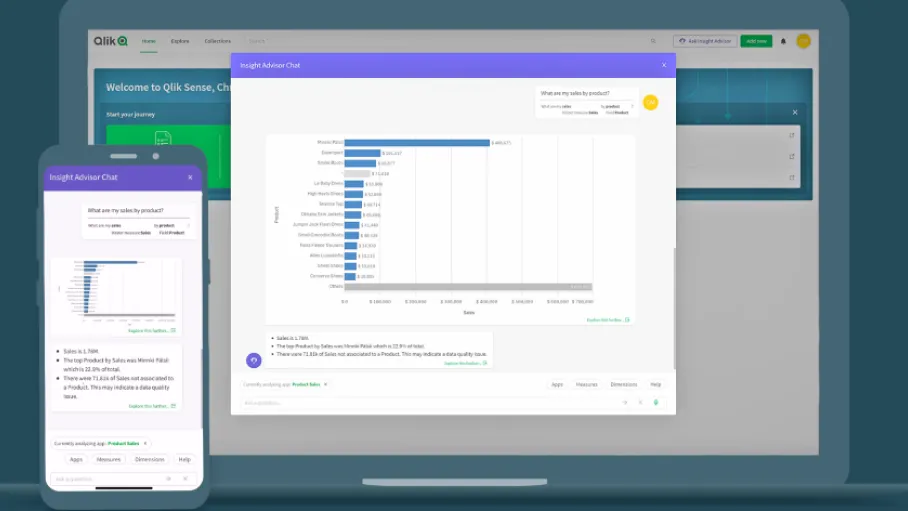
2. Qlik Insight Bot
Qlik provides integrated chat-based insights and can connect to Slack. Its visualisations and homepage metrics help users track trends, but its suggestions often remain surface-level without deep reasoning.
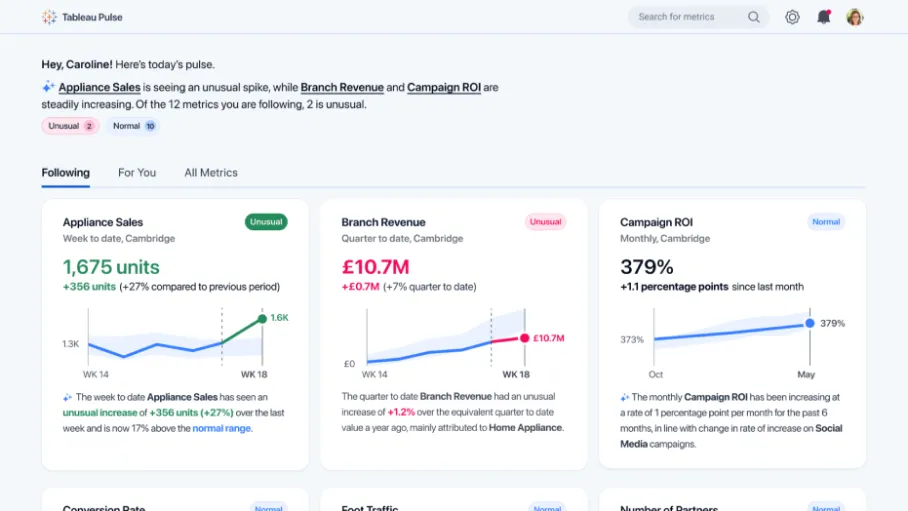
3. Tableau Pulse (Einstein AI)
Tableau’s integrated AI insights within dashboards highlight anomalies and provide “Explore further” prompts. Users appreciate seeing parameters selected and understanding the “why” behind recommendations, though initial setup can be complex.
| Feature | IBM Watson Analytics | Qlik Sense | Tableau Pulse |
|---|---|---|---|
| Entry Point | Chat bar in the bottom right | Button on top navigation | Data visualisation in homepage |
| Experience Type | Chatbot | Modal immersive experience | Immersive full-screen experience |
| Unique Capabilities | Uses citations for answers; contextual information. | 3rd Party integrations; visual tracking metrics. | Deeper analysis; selected parameters; data visualisations. |
Creating an effective Copilot
What did this Copilot actually need to do?
Beyond the three-step builder, I mapped what would genuinely help an analyst through a query. Five things stood out.
Suggest in plain language
Turn a natural-language question into the right metrics, filters and attributes.
Show the reasoning
Explain why each metric or filter was picked, so the analyst can trust the suggestion.
Preview the insights
Show visualisations from the query report inside the Copilot, before it is even run.
Generative insights
Periodic insights to help analysts keep an eye on the health of their organisation.
Drive discoverability
Surface templates and the lesser-used corners of Viva Insights that analysts miss today.
Scratching up concepts
A look at the different routes that we can take.
Microsoft’s Copilot experience guidelines lay out three ways a Copilot can show up in a product. Which one you pick comes down to what your users actually need.

Immersive
Whole knowledge-based focus

Assistive
In-app focus

Embedded
Single-entity focus
So what do we choose?
This was an entirely new paradigm for our users, so rather than bet on one approach up front, we built concepts for all three and tested them.
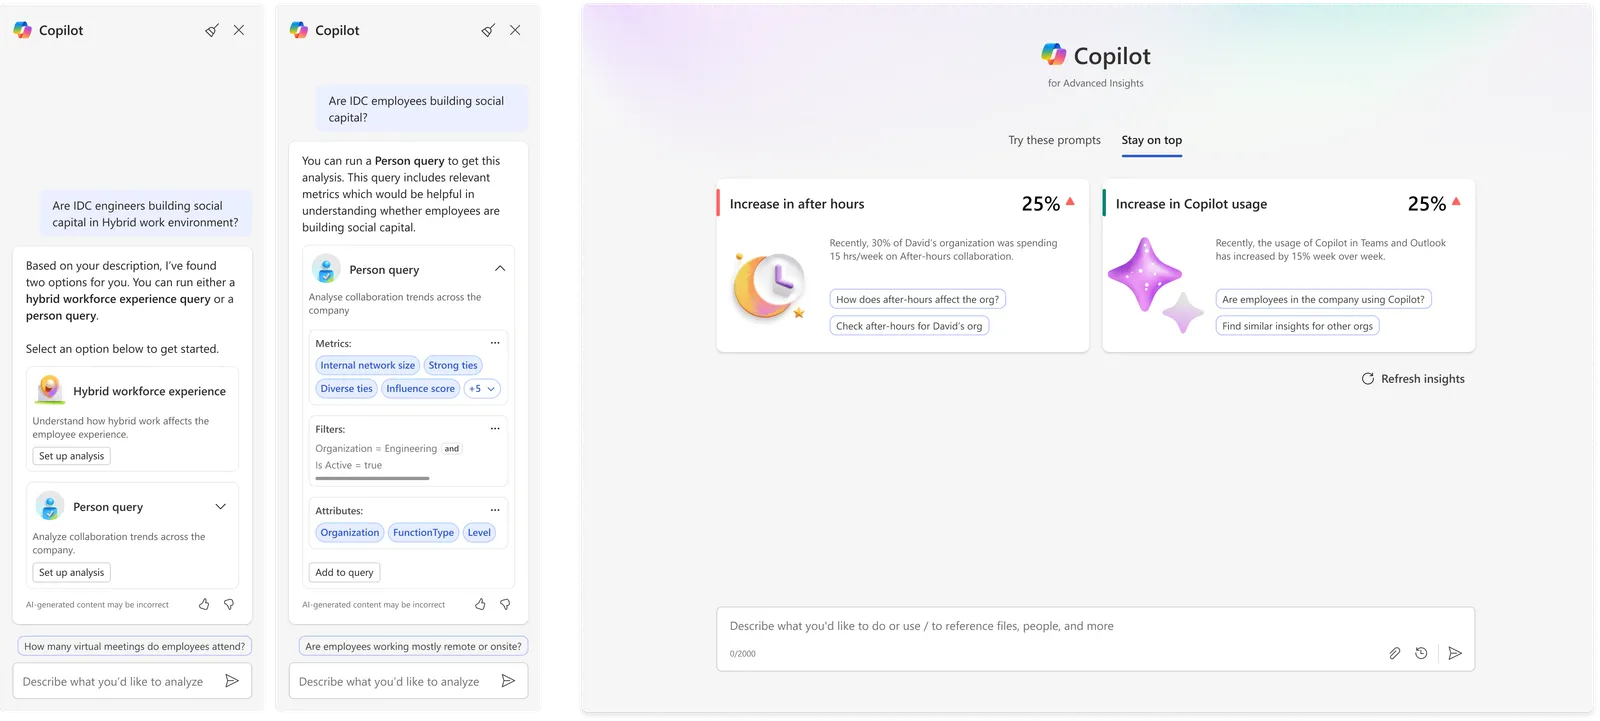
1. Assistive experience
This is the default for most Copilots. It picks up the context of the page you’re on and makes its suggestions from there.
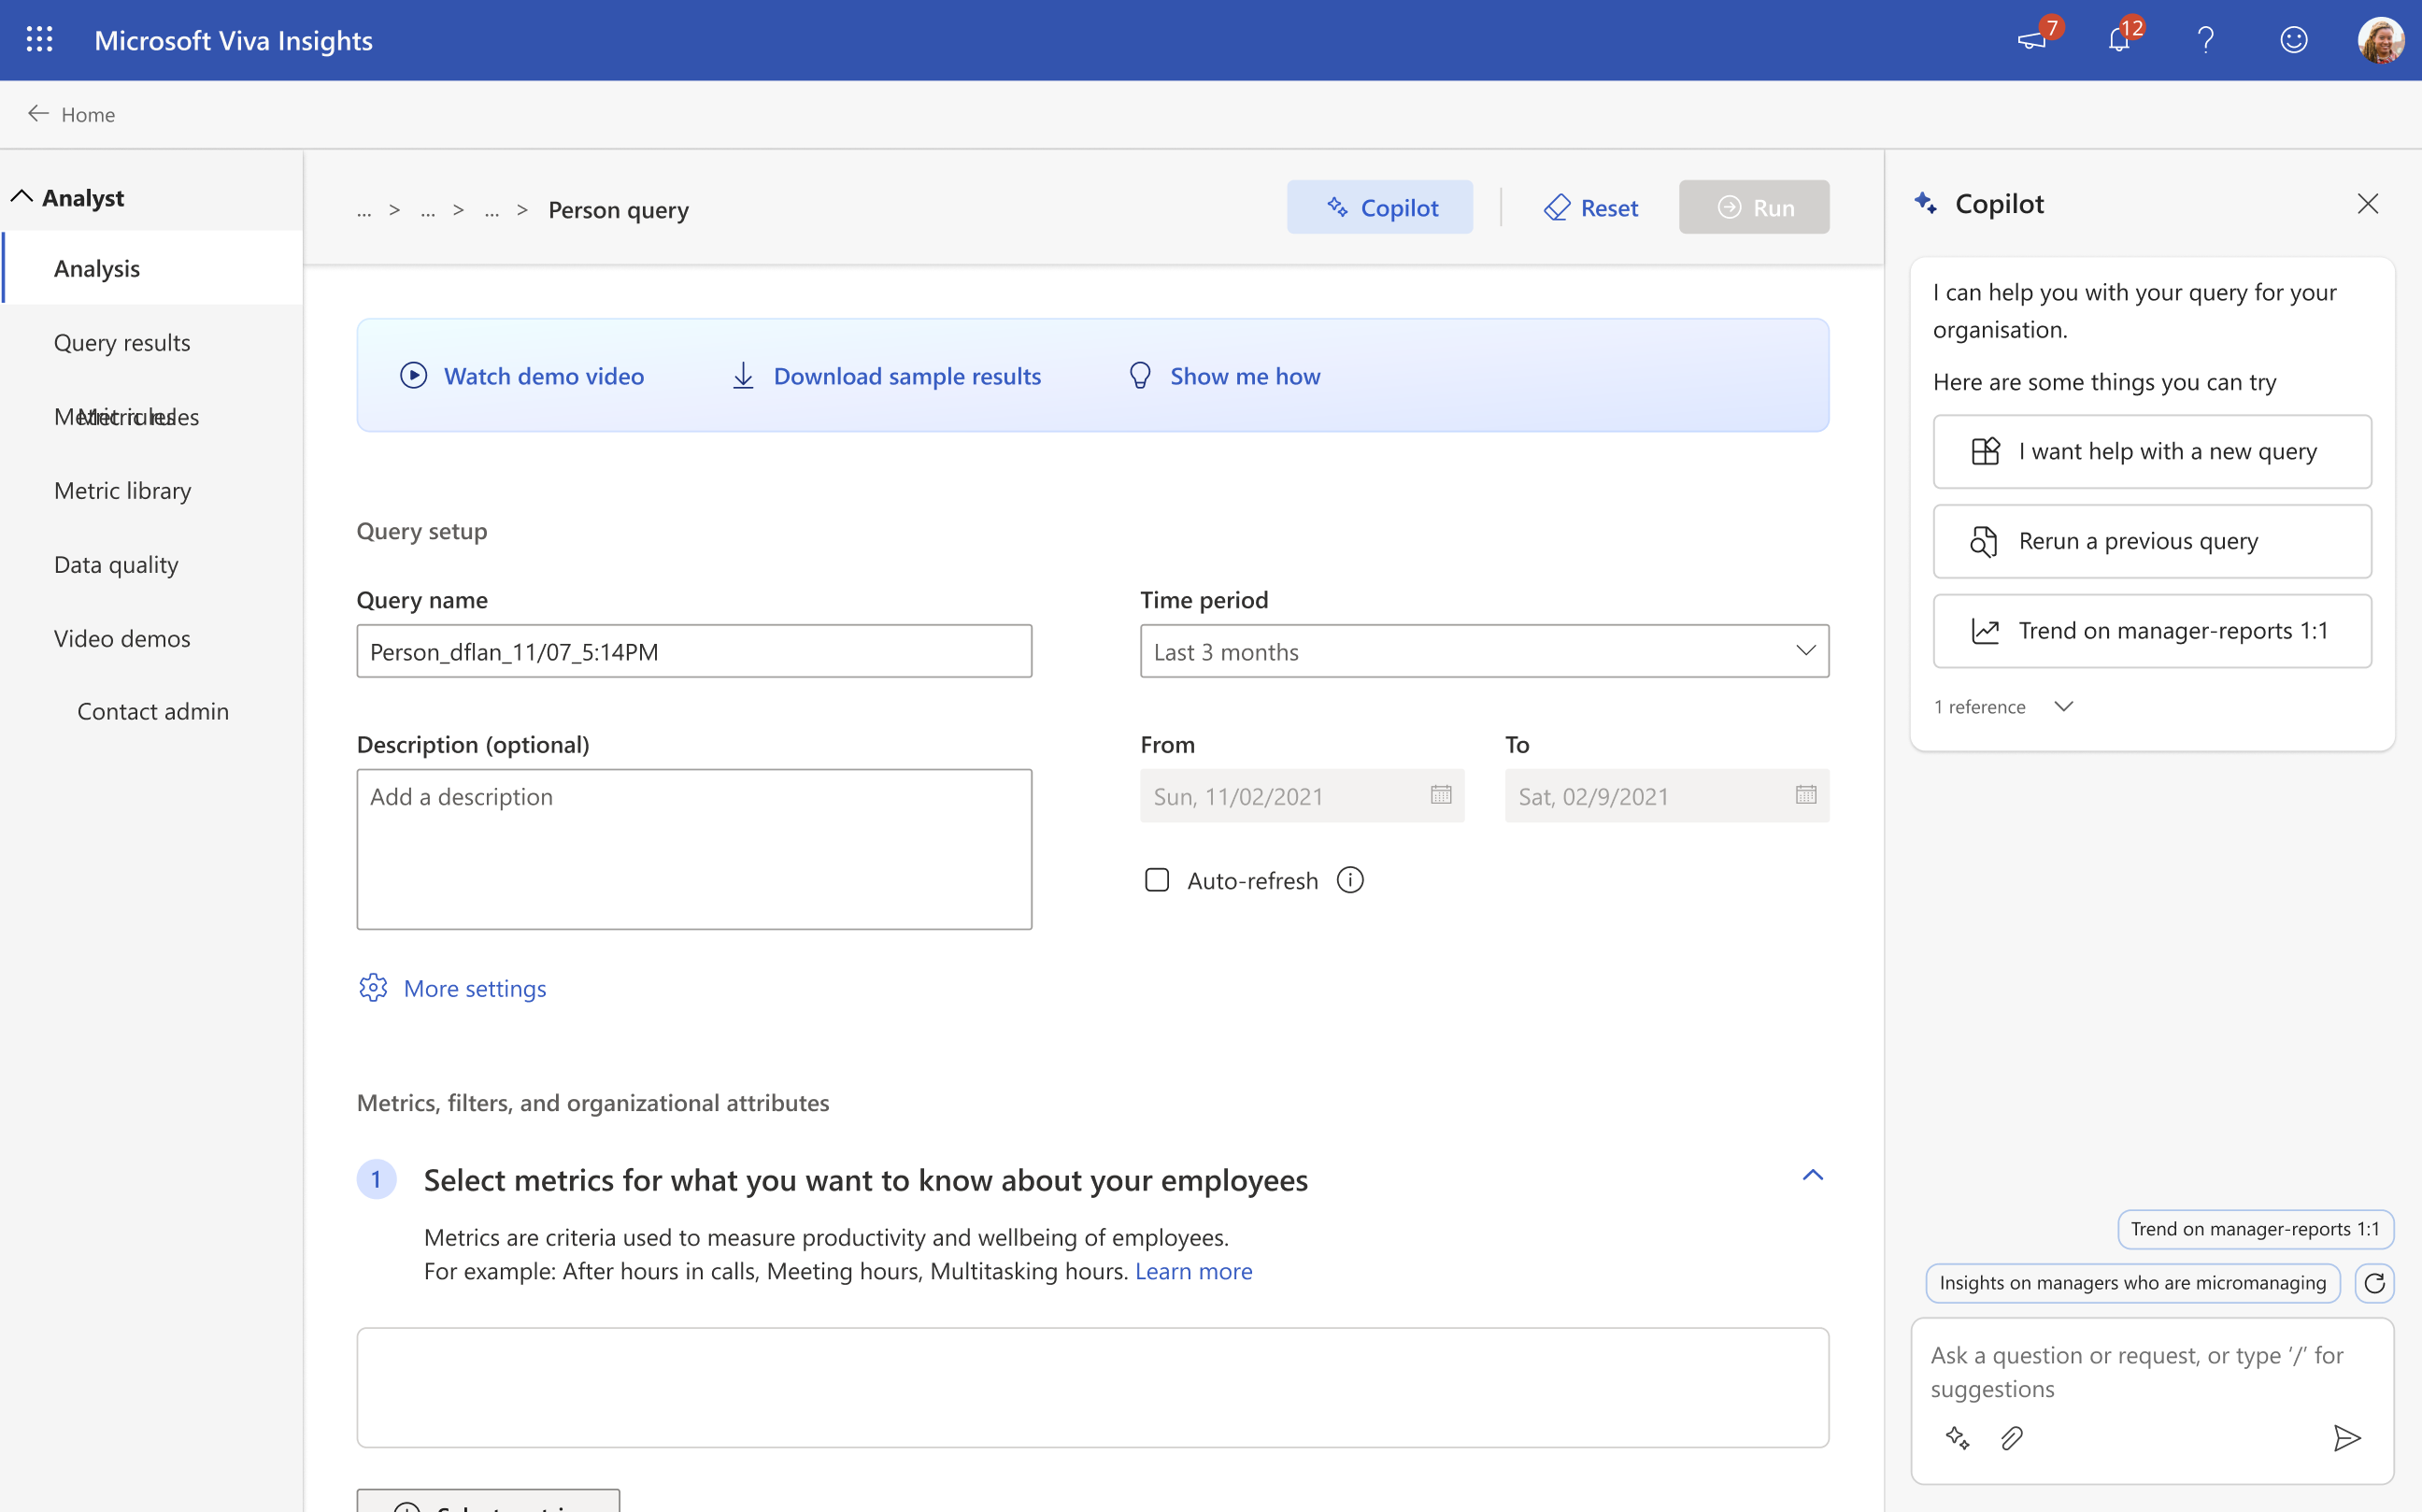
Starting off
Suggestions on what the Copilot can do.
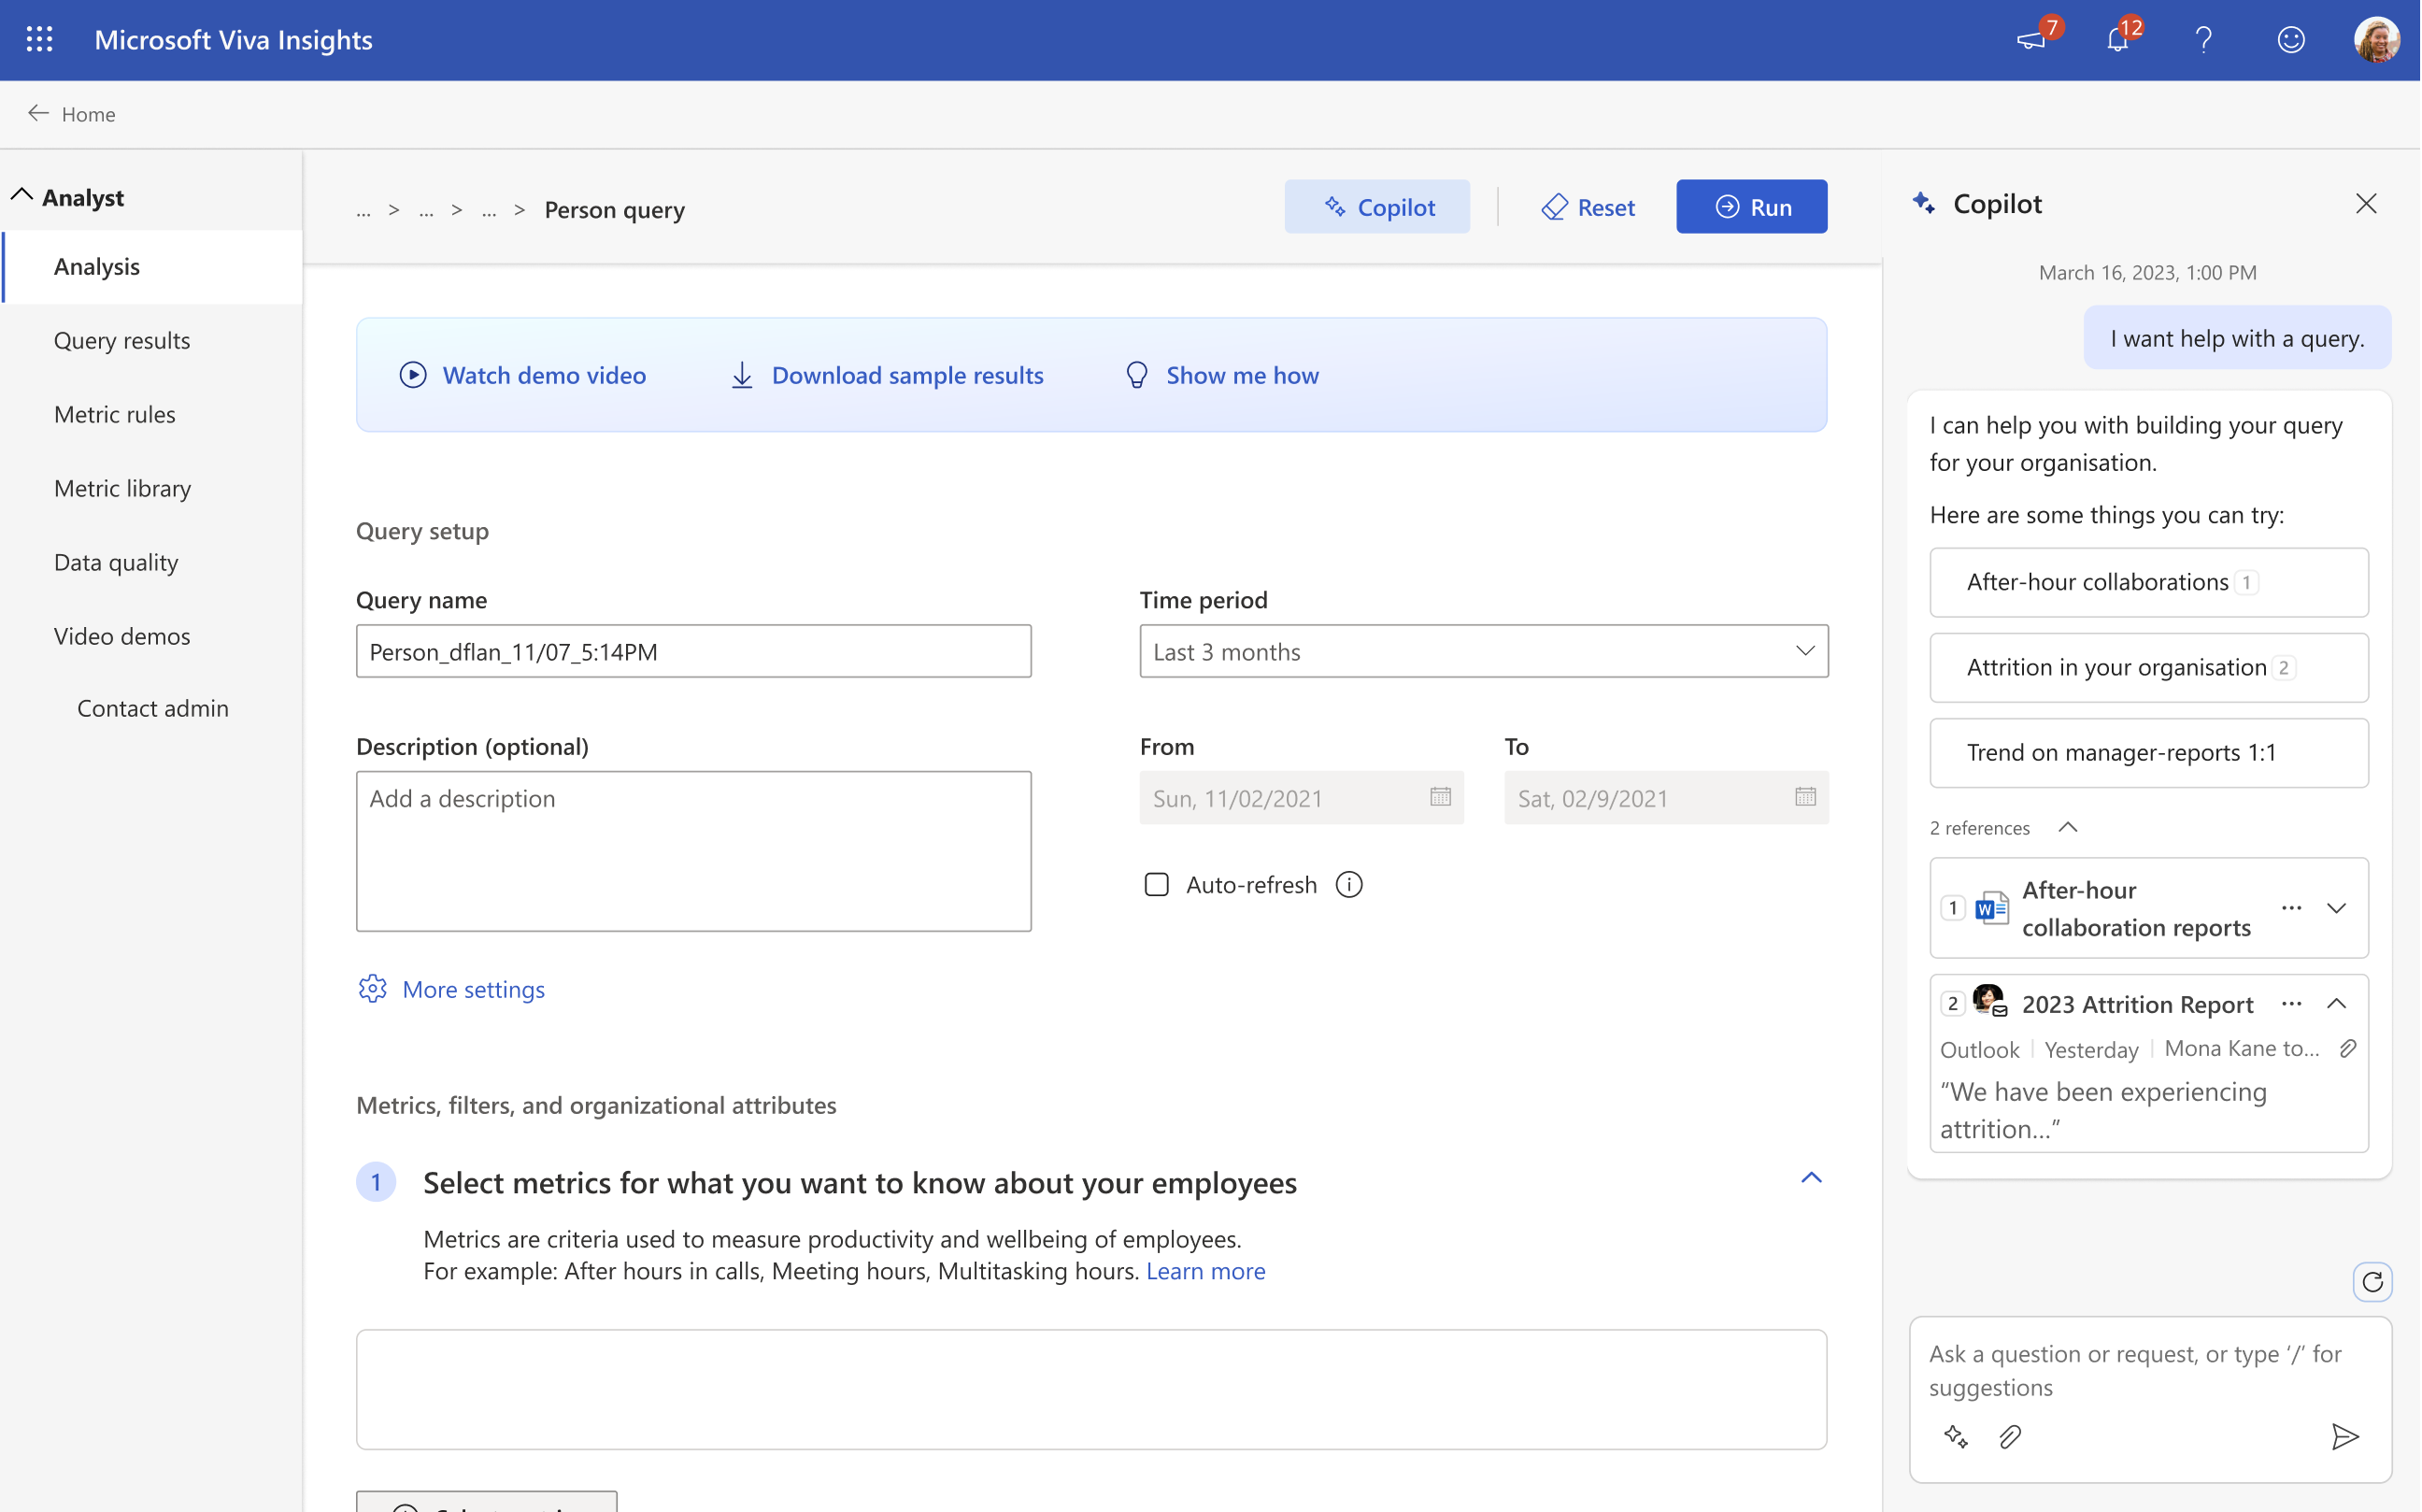
References on every answer
AI has to earn trust, so the analyst can see exactly where every suggestion is coming from.
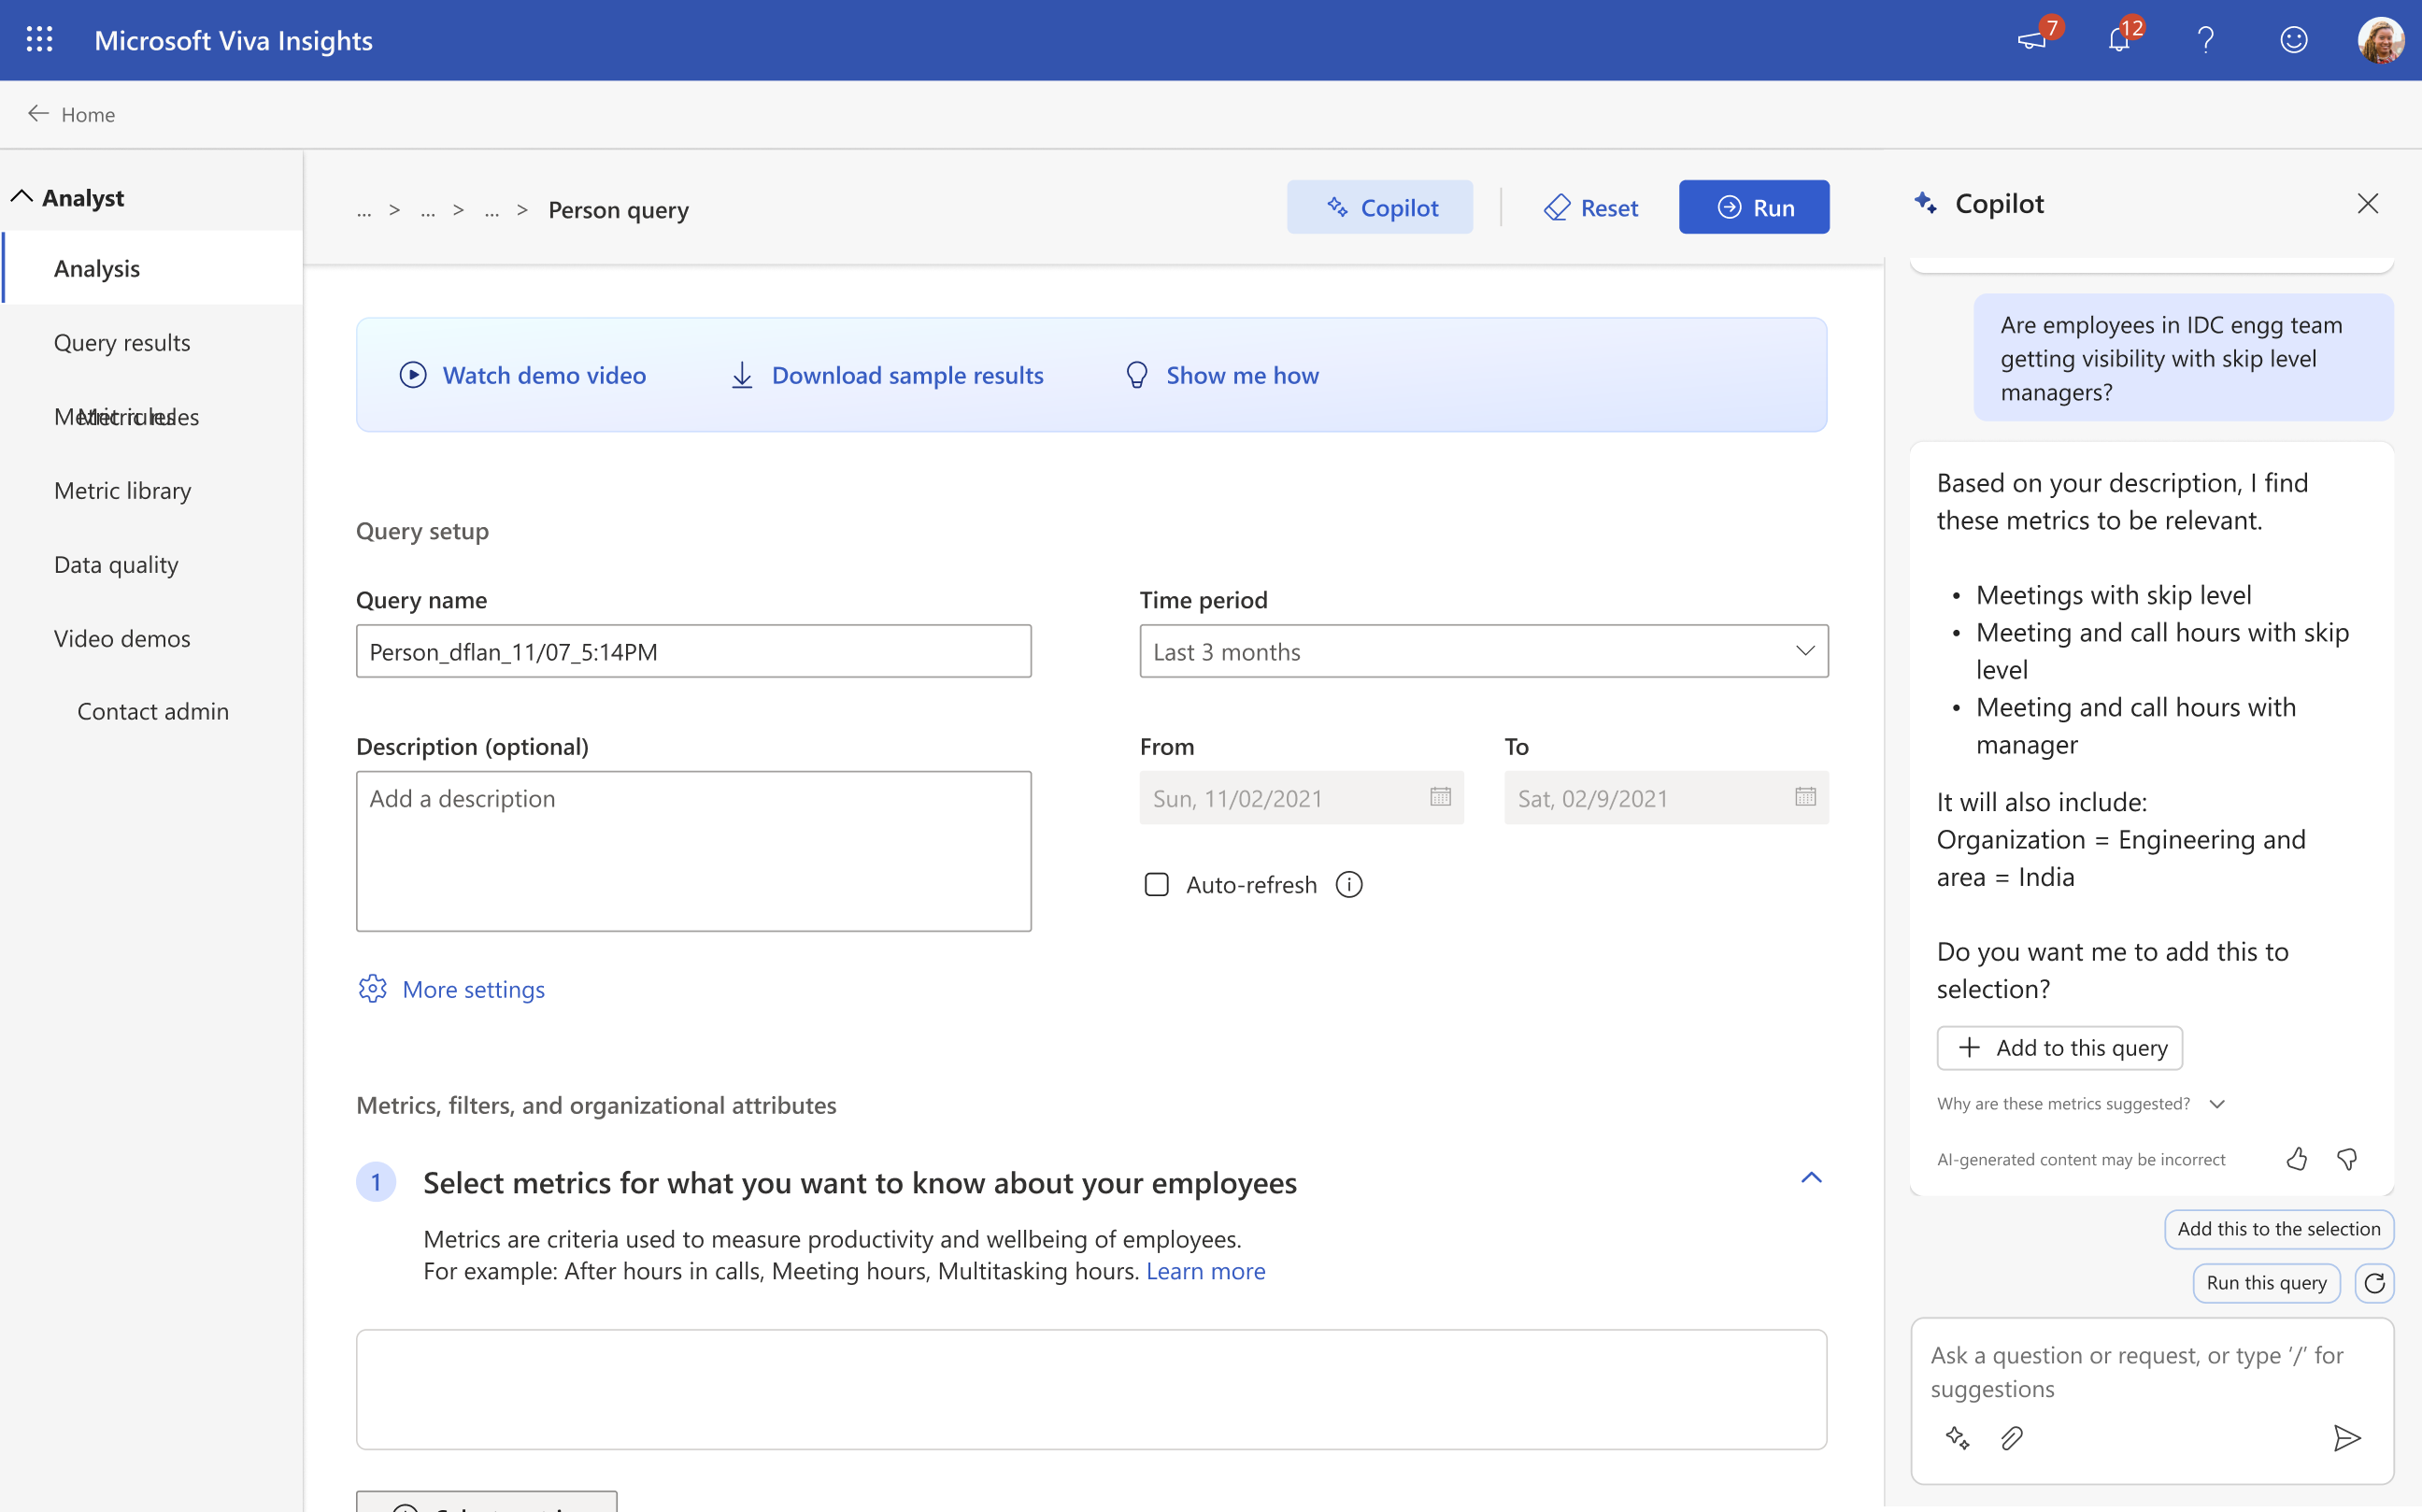
Metric and filter suggestions
Upon asking a question, the Copilot will suggest the right metrics and filters for the query, making it easier to run in one single click.
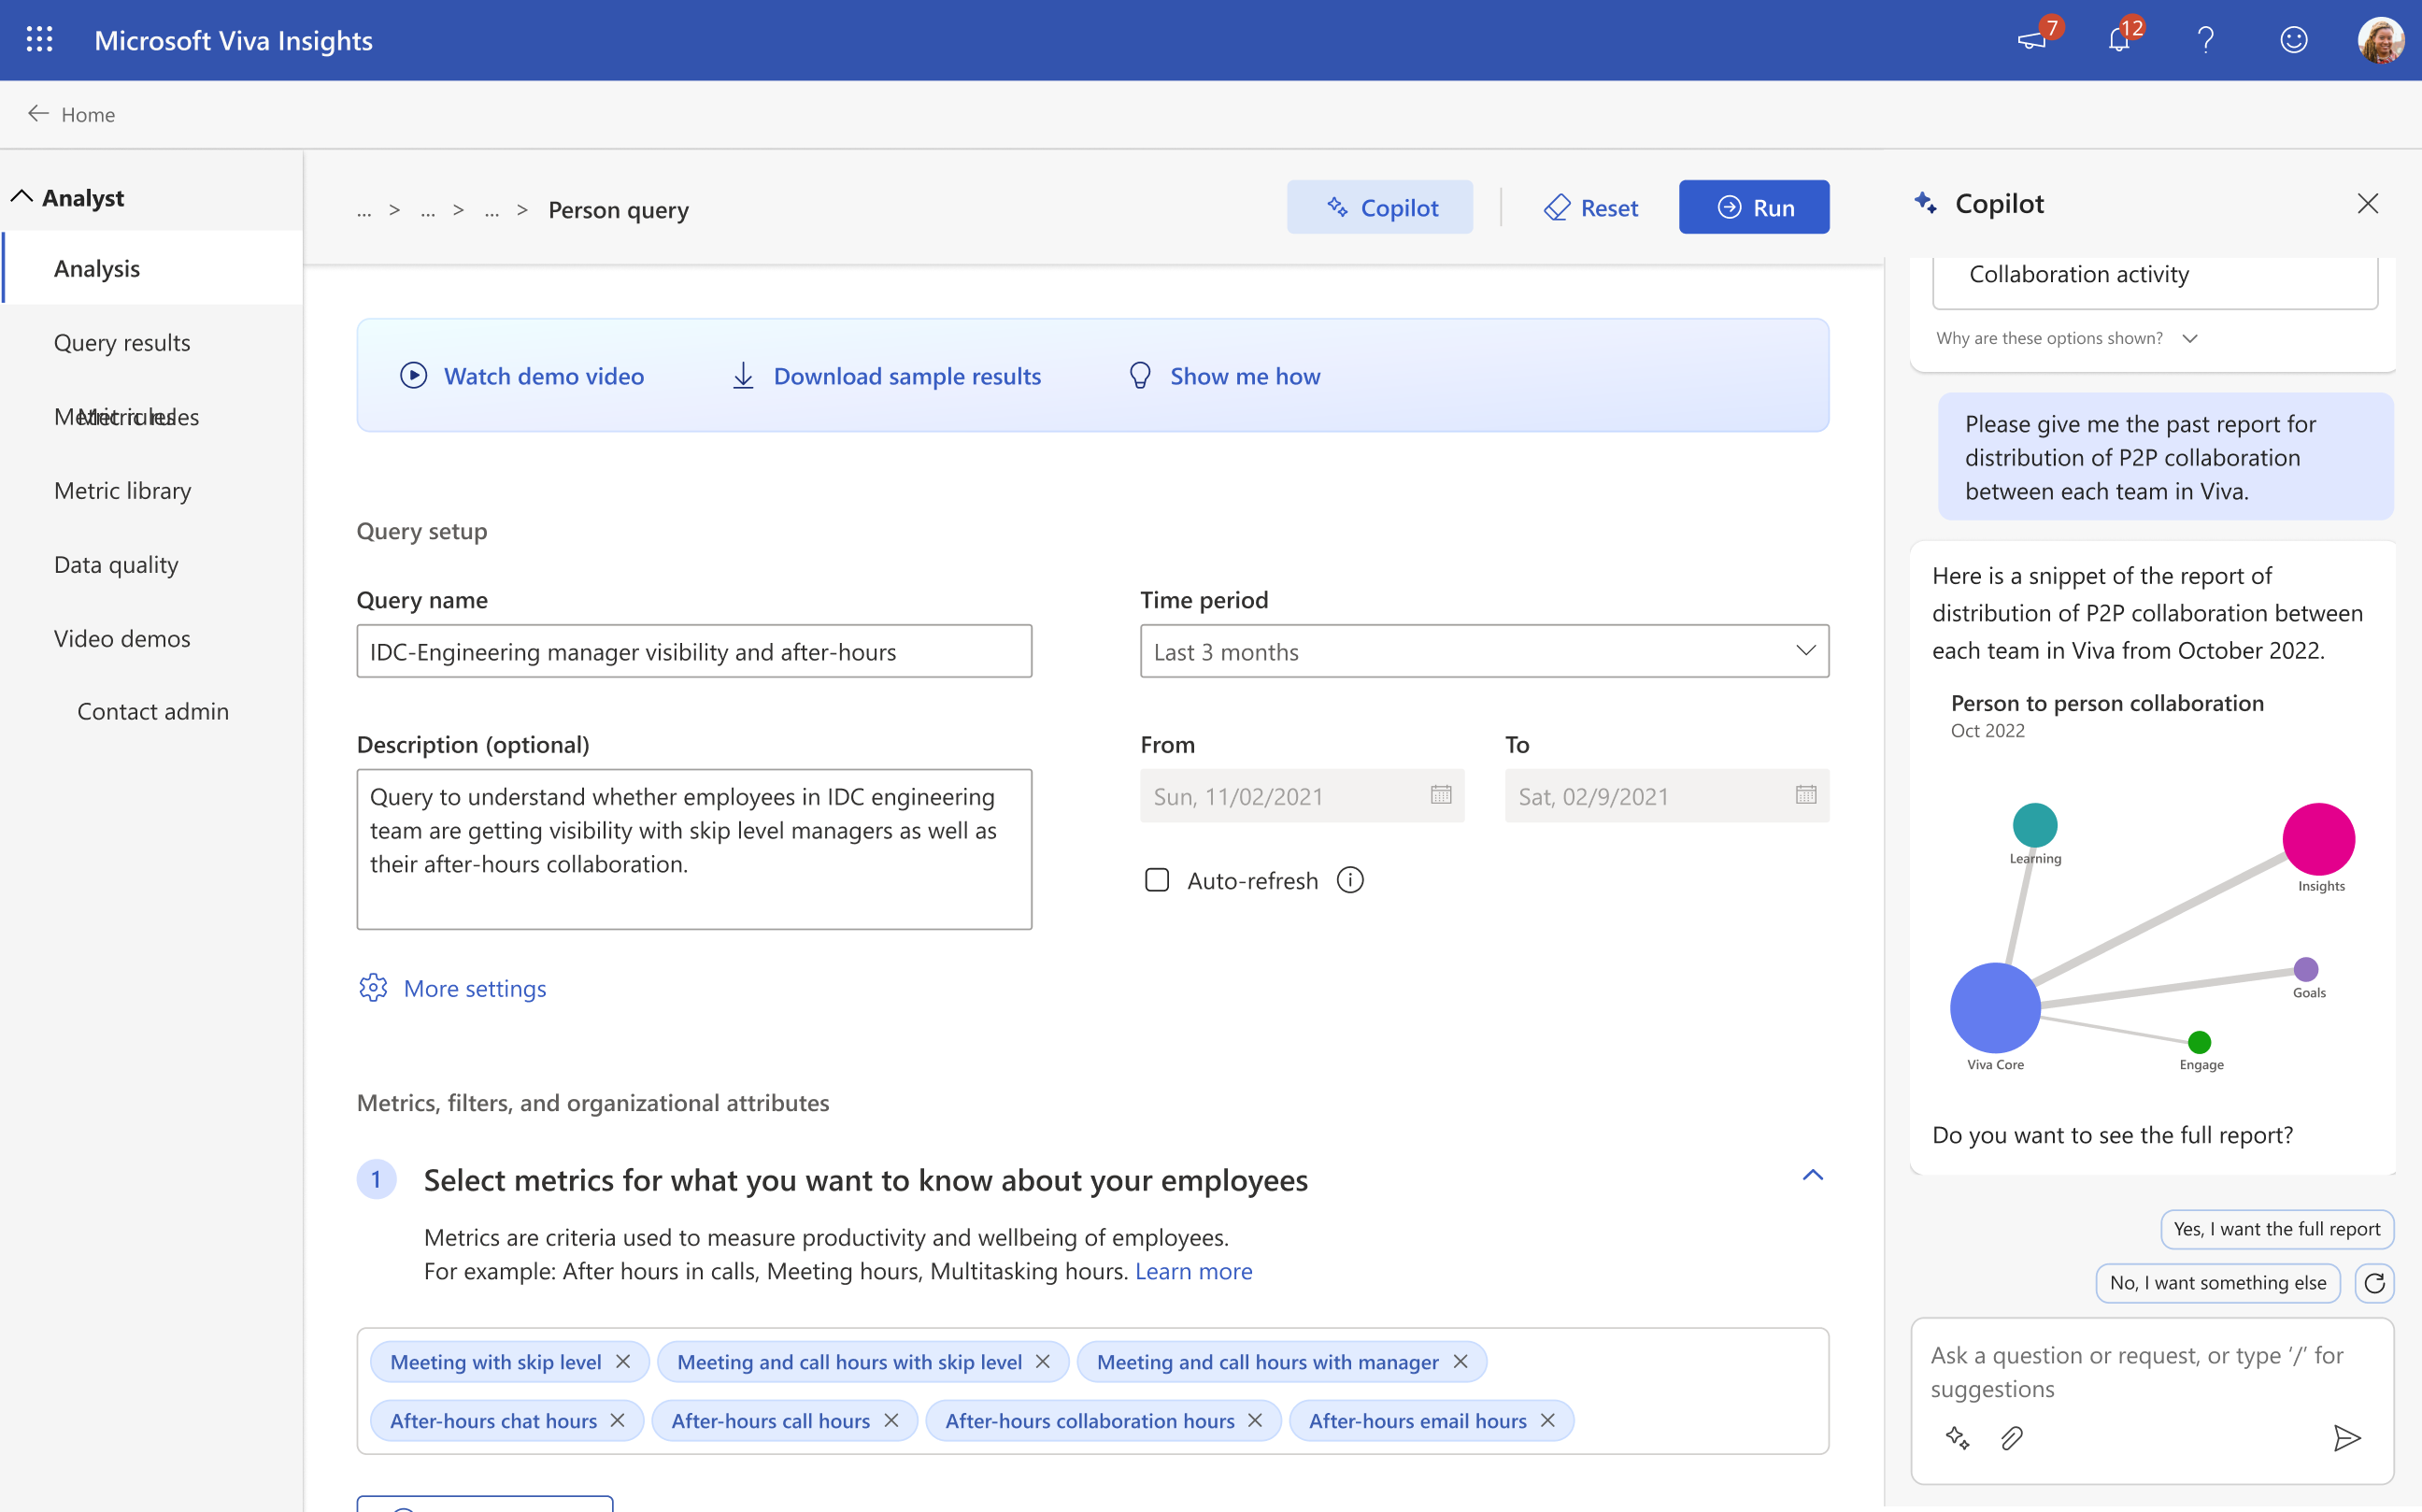
Visualisations
Every query produces data worth looking at. So before running one, Copilot previews the visualisations an analyst will get out of it.
2. Embedded experience
A more natural approach is to let Copilot help inside the flow of work. Anyone already deep in the product doesn’t have to learn a new way of doing things, since it’s baked into what they’re already doing.
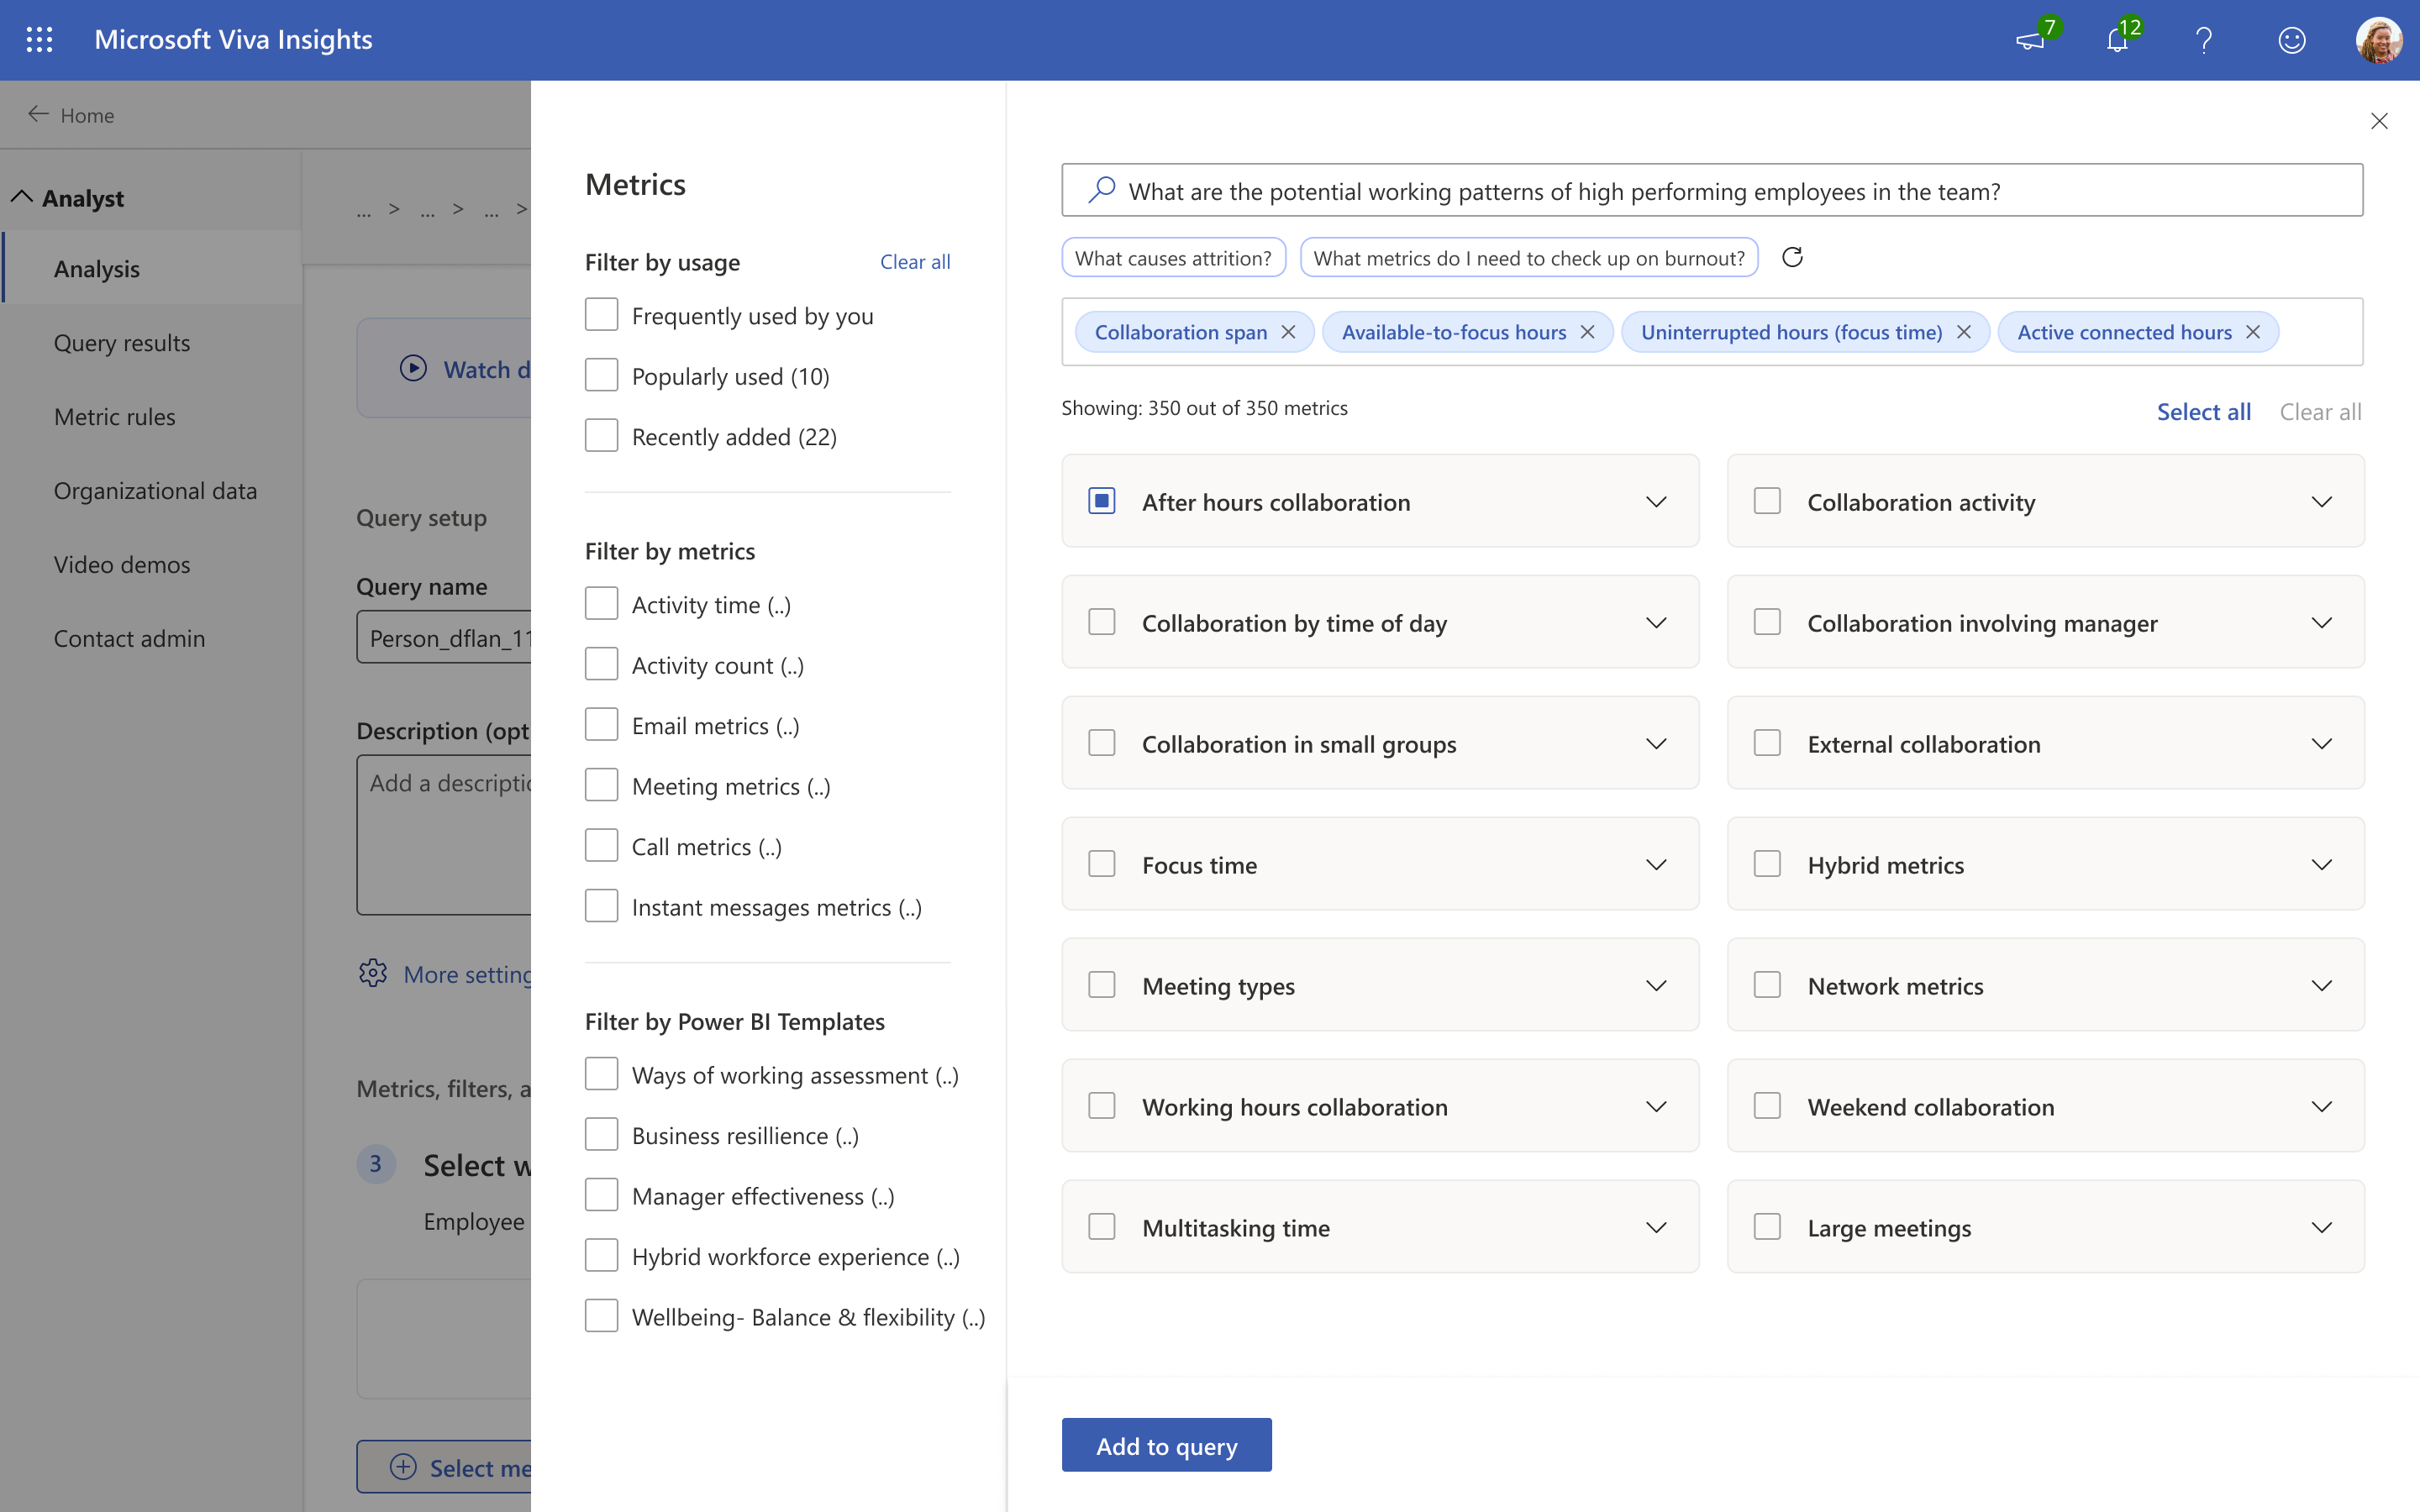
Metric suggestions
The metric flyout (very similar to the attribute flyout) was one of the obvious places for an embedded Copilot, since metrics shape what the query becomes. The analyst types in what they want and Copilot suggests the right metrics to add.
Building from context
One of the quirkier ideas I had was to build the query straight from its name and description in one click. It would also nudge analysts to name and describe their queries better. The catch was that analysts rarely change the default name, and almost never add a description.
3. Immersive experience
A full-page Copilot had potential too, with generative, real-time insights into the whole organisation.
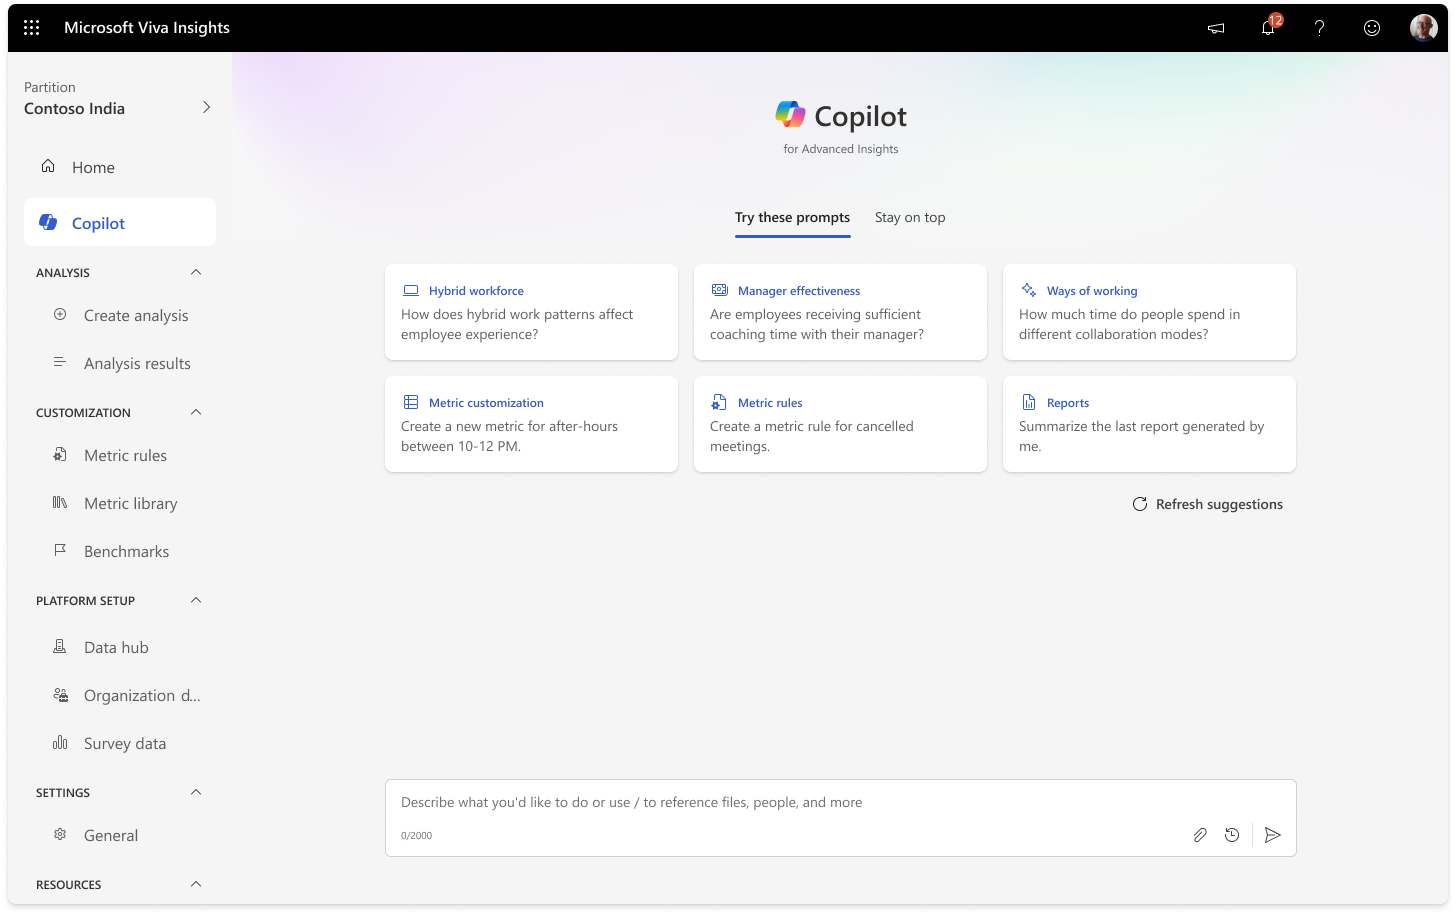
The Copilot home
This page can be accessed directly from the Viva Insights homepage by clicking on the side navbar, or better yet, by scrolling down the homepage to access it (inspired by Bing Copilot). It provides quick suggestions on what they can run and ask the Copilot, similar to the sidecar experience.
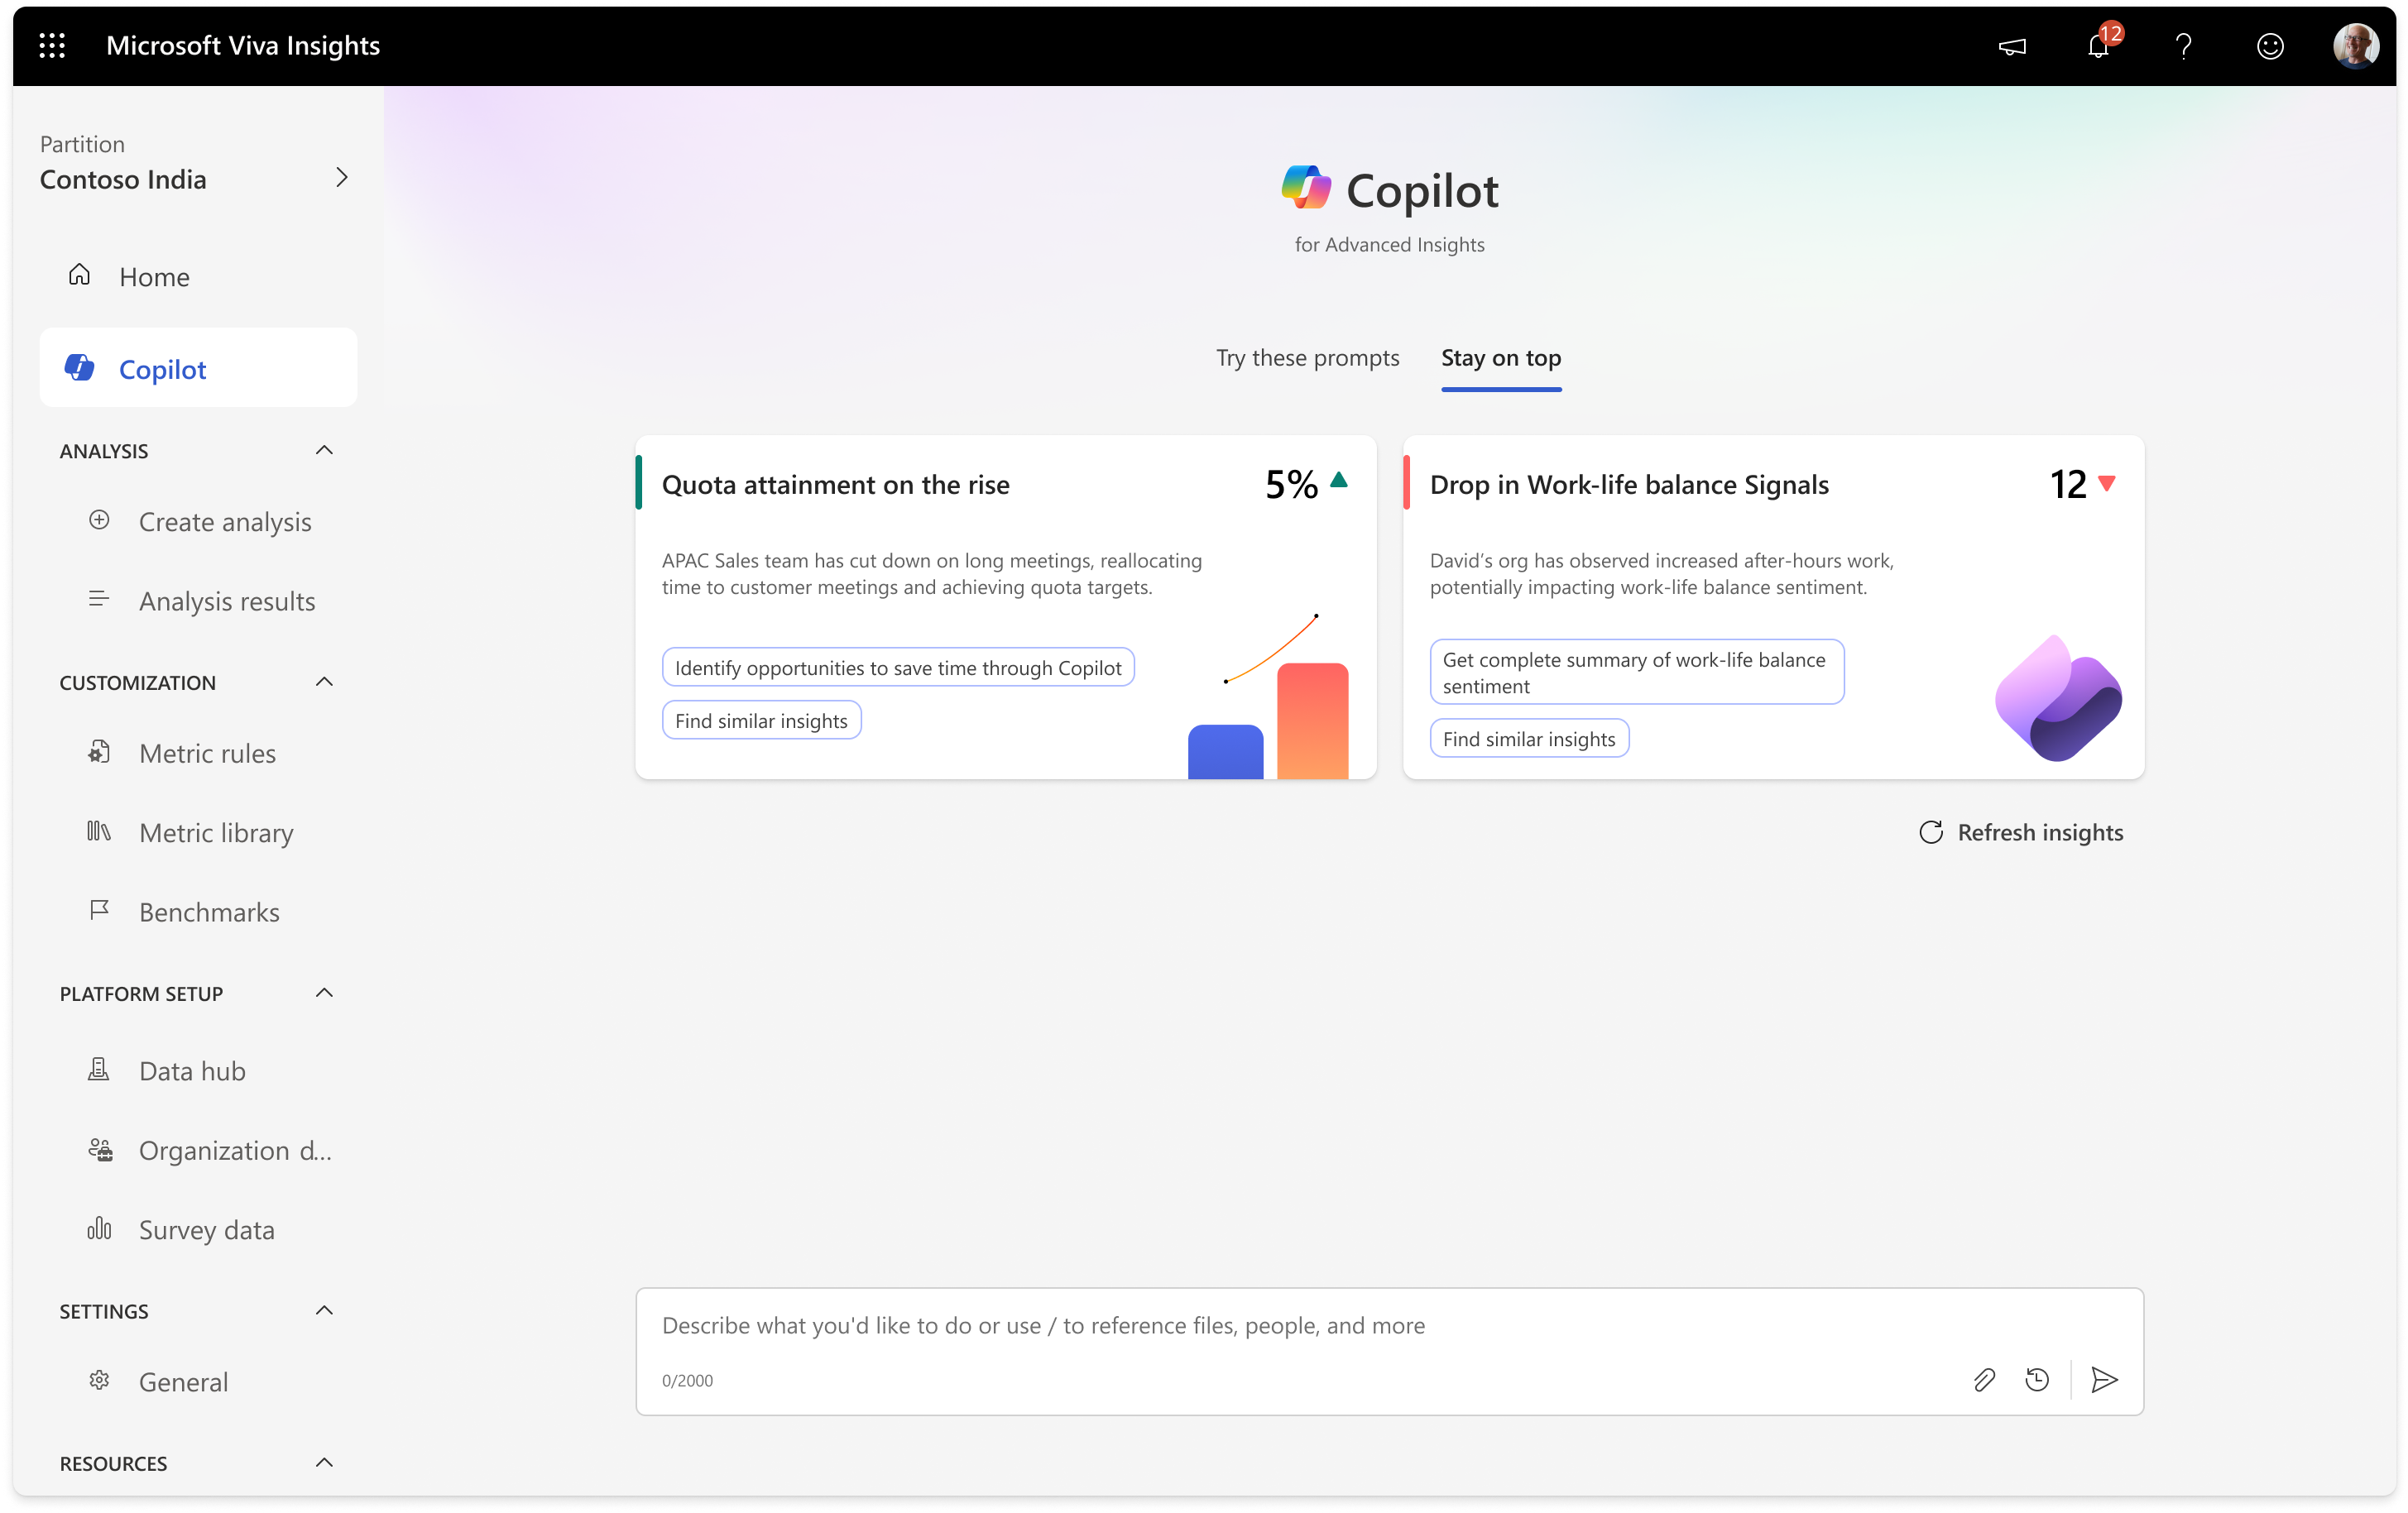
Generative Insights
This is the most interesting part of the Copilot: it progressively builds up insights about the analyst’s organisation. The more queries they ran, the better the predictions got.
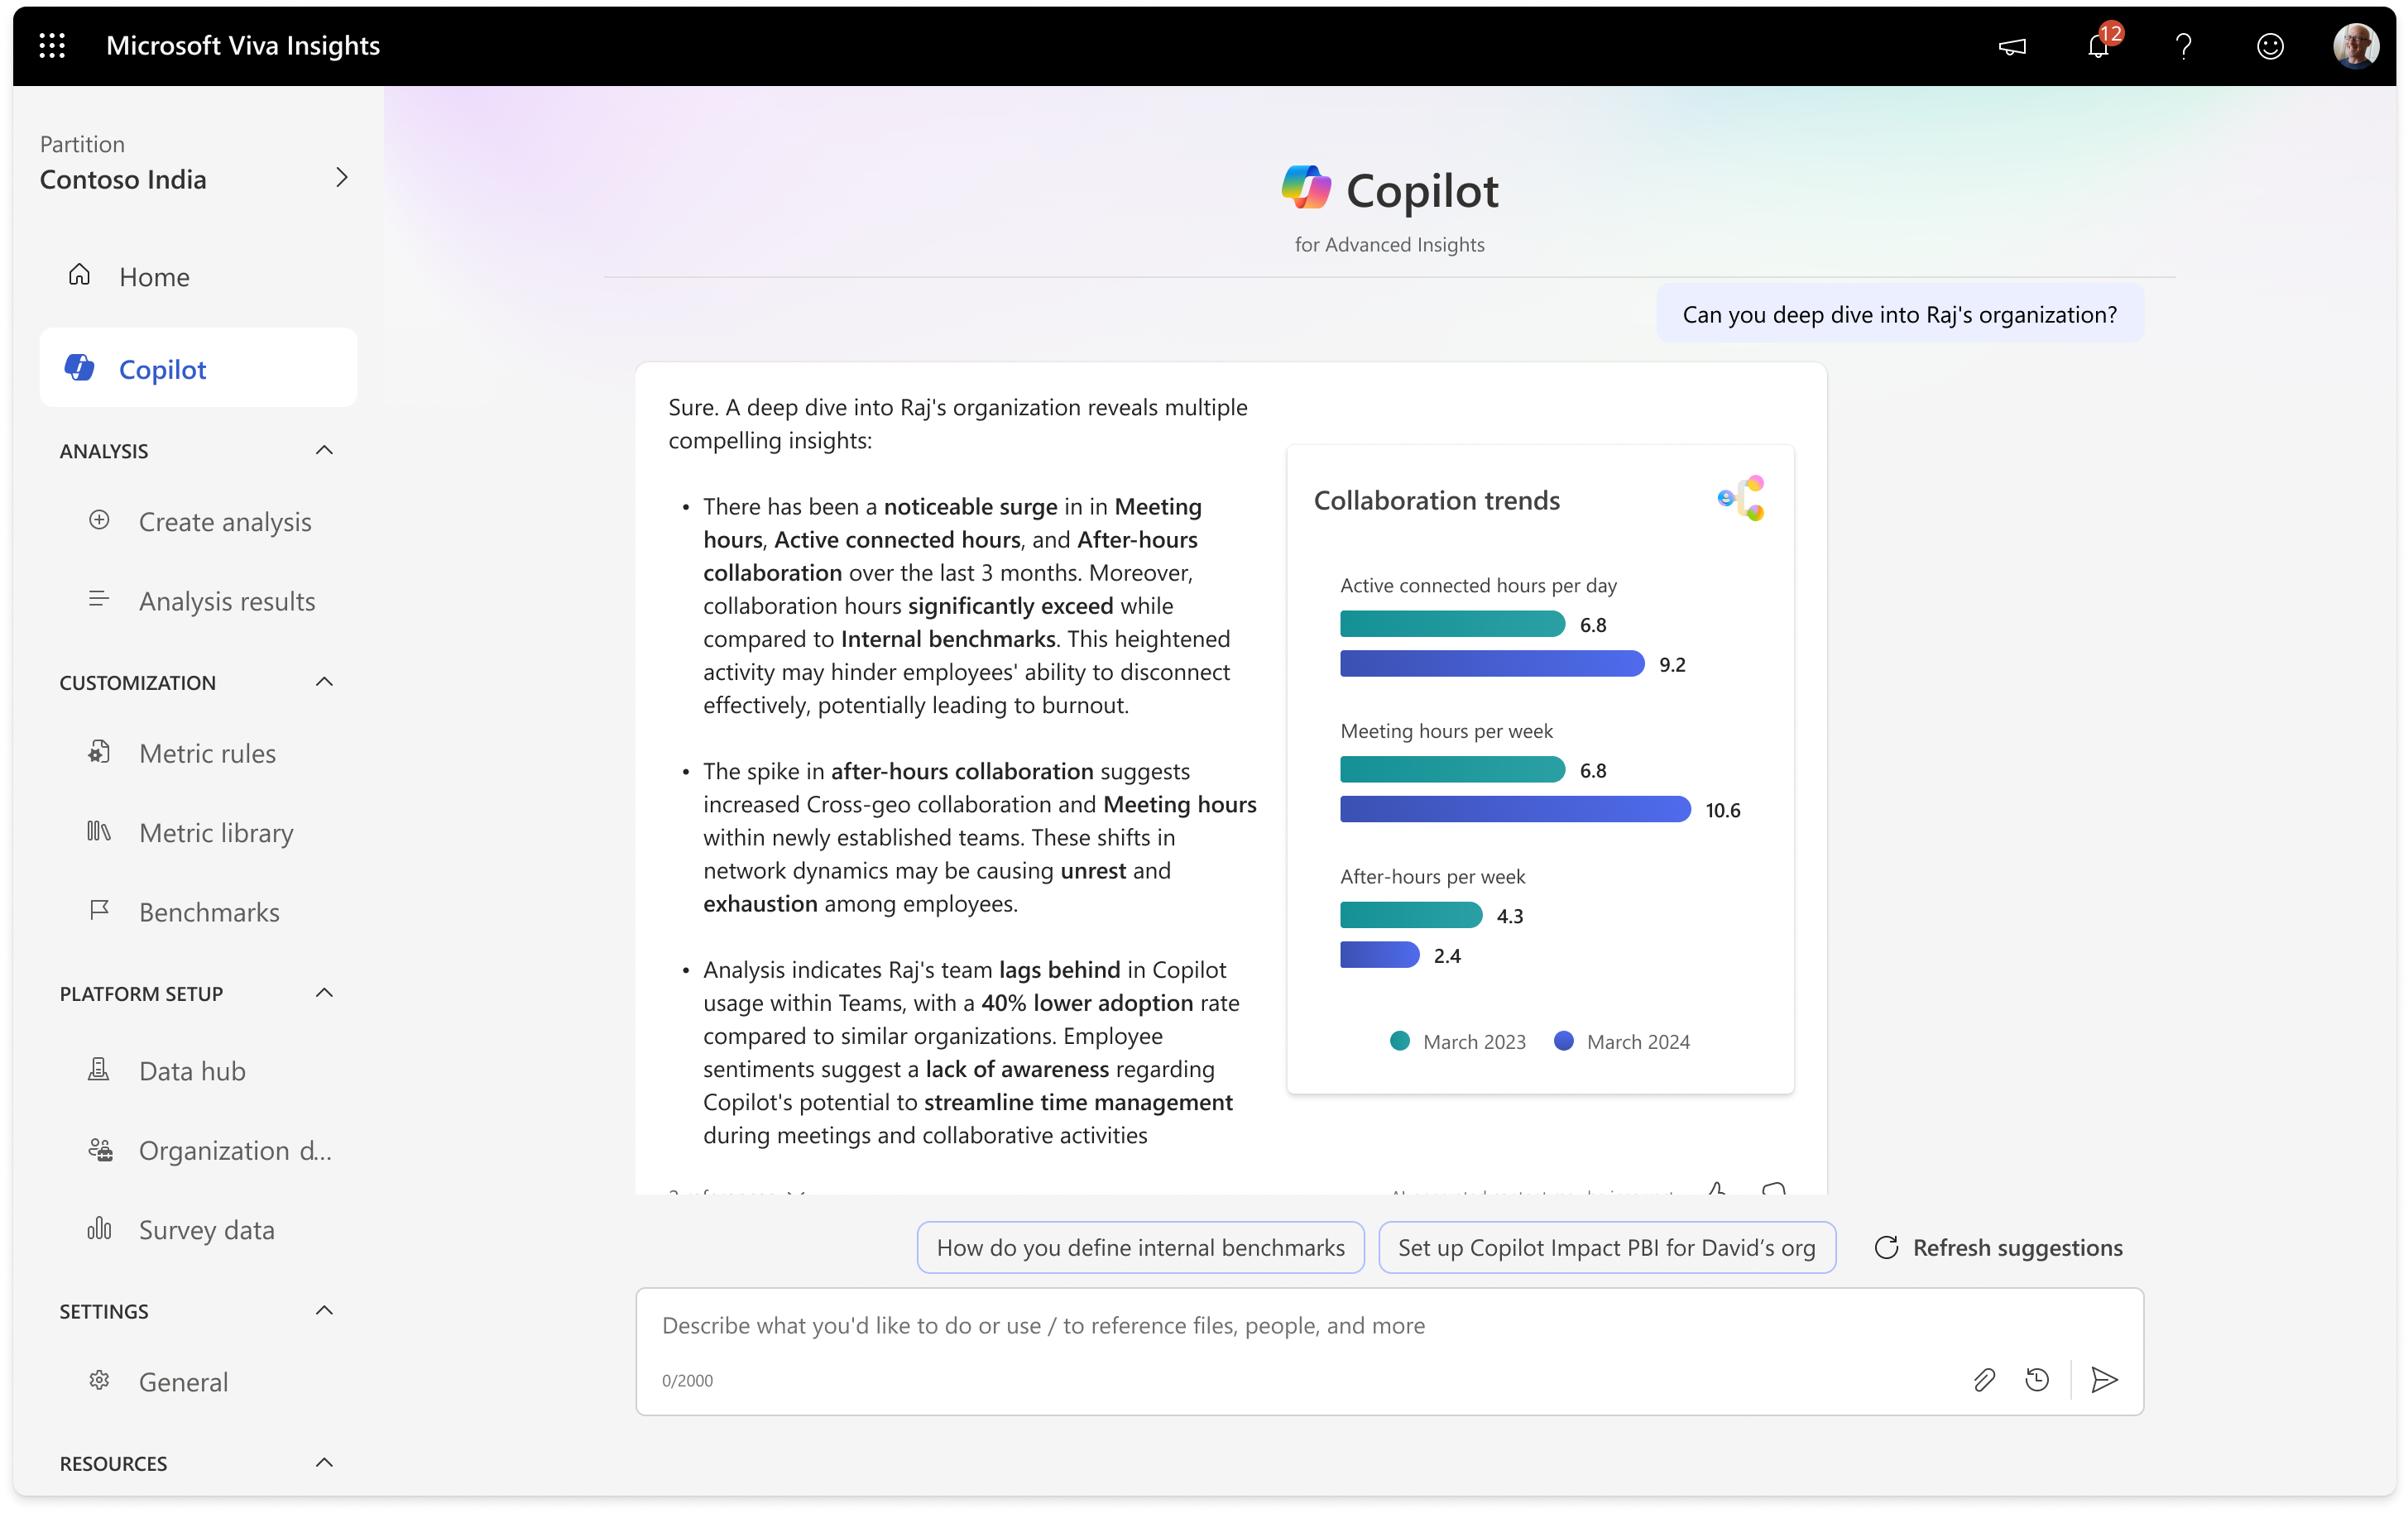
Better representation of data
While it was a novel idea to show the visualisations in the Sidecar experience, it's best seen in a bigger viewport. The immersive experience is the better canvas for data-dense views.
Validating with our customers
Because who better to ask than someone who’s well versed with our product.
To check our approach against real needs, we ran a session with the Viva Customer Connection Program: 74 participants from a wide range of global organisations. We wanted to see whether Copilot actually held up, and how analysts at different experience levels read its potential to speed up query building and help with wider analysis.
We wanted to validate 3 major things.
1
How effectively can Copilot guide analysts through complex query-building tasks?
2
Can it suggest relevant metrics and filters to streamline analysis?
3
Are these designs aligned with their preferred interaction methods?
Some of our customers included


Some key highlights of the interviews
Copilot was seen as especially valuable for less experienced analysts, enabling them to overcome the steep learning curve of Viva Insights and navigate the tool more efficiently.
Participants stressed the importance of Copilot identifying analytical blind spots, offering a comprehensive range of metric recommendations rather than just obvious or top-performing ones.
Customers emphasised the need for greater visibility into metric calculation methods and better customisation options including creating custom metrics tailored to their organisation.
Beyond query building, users sought help from Copilot in summarising query results effectively, especially for presenting complex analyses to stakeholders.
“This has a potential of building complex queries much easier and more efficient. Instead of adding metrics one by one, it simplifies the process, saving time and effort.”

“Copilot is incredibly helpful in identifying relevant metrics, but I'd love to see it uncover potential blind spots in the language used. Validating the most important metrics while comparing them to other potential ones is crucial, and I think this feature would add significant value.”

“I think its gonna be really useful in getting kind of through the learning curve a lot quicker!”

The final designs
What got shipped out finally.
The customer feedback really shaped the direction we took. The final product shipped with a set of features our customers had told us were essential.
Homepage Discoverability
We wanted the Copilot to be easy to find from the homepage, so we used the feature discovery card for it. We also added an FRE (first-run experience), which is standard across Microsoft for all Copilots in our product line.
The sidecar
As the Analyst lands in the Create Analysis page, they are greeted with the Copilot and how it can help them. The analyst can ask their query and the Copilot will pick the right query to run in a fraction of a minute.
The query builder
The Copilot pulls everything into a single side panel. Analysts can hover over any metric to see its definition right there, instead of guessing. It brings the five-step query process, the Viva Insights glossary, and the reasoning behind each query type into one place, so a query that used to take 30 to 60 minutes to set up now takes about 15 seconds.
The make-or-break call: the whole filter in one pane.
The hardest part of that single panel was the filter system. A filter is a data attribute, an operator, and its values, and it can nest up to three levels deep, each level joined by an AND or an OR. Fitting all of that into one pane, without making the analyst scroll, was genuinely make-or-break for the feature.
I designed a few different options and took them through the triad with PM and engineering. We landed on the third, because it was the one that showed the full complexity of a query without feeling complex to read.
Designing for trust, not just answers.
What decided whether analysts actually used Copilot wasn't the AI, it was whether they could trust it. Analysts won't run a query they can't reason about. So every suggestion shows its working: the exact metrics and filters Copilot chose, the reasoning behind them, and references back to the source, all editable before anything runs.
That transparency is what moved Copilot from a novelty into something analysts were willing to submit.
Did it work?
We set three measures of success up front.
Before designing, the triad agreed on what a win would look like, so we weren’t just shipping a feature and hoping it stuck.
Adoption
Are analysts reaching for Copilot when they start a query? (query creations started)
Efficiency
Does it get them from intent to a submitted query faster? (queries successfully run)
Retention
Do they come back for the next query, not just try it once? (active users and repeat use)
Where it landed.
Copilot shipped to GA in January 2025. By March, active users were up by around 200% and active tenants by about 150%. A query that used to take 30 to 60 minutes to set up now took about 15 seconds.
It also pulled analysts towards building their own custom queries rather than falling back on Power BI, and around 20% of queries were submitted straight from Copilot without a single edit. That last one mattered most to me: it meant Copilot wasn’t just suggesting, it was right often enough that analysts trusted it to run as-is.
Looking back
What I’d keep, and what I’d change.
The thing I keep coming back to is that letting people describe what they want in plain language genuinely lowered the barrier we set out to remove. That was the whole bet, and it held.
Honestly, the hardest part wasn't the AI, it was earning that trust, and I learned it a bit late. If I did it again, I'd pressure-test the trust model much earlier, before building out three full interaction paradigms, because that turned out to be the thing that actually decided adoption.
My involvement covered design through the GA ship in January 2025.